Dlouhodobá prognóza
Tyto informace jsou v rámci marketingové komunikace poskytovány retailovým i profesionálním klientům. Neobsahují investiční rady a doporučení, nabídky k nebo žádosti o účast na jakékoli transakci nebo strategii spojené s finančními nástroji a neměly by tak být chápány. Předchozí výkon není zárukou ani predikcí budoucího výkonu. Instant Trading EU Ltd. neručí a nezodpovídá za přesnost nebo úplnost poskytnutých informací, ani za ztrátu vyplývající z jakékoliv investice na základě analýzy, předpovědi nebo jiných informací poskytnutých zaměstnancem společnosti nebo jiným způsobem. Úplné znění Odmítnutí odpovědnosti je k dispozici zde.
Overview:
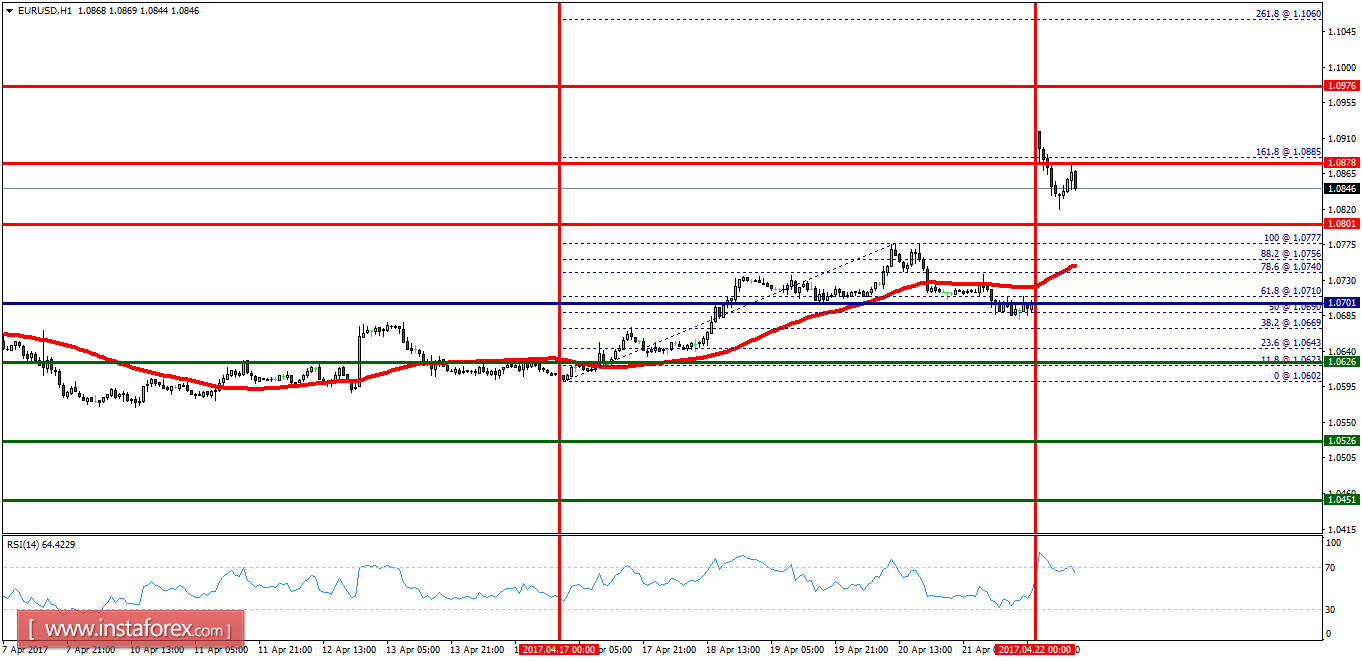
- On the one-hour chart, the EUR/USD pair is indicating to a bullish trend from the support levels of 1.0801 and 1.0701. Currently, the price is in a bullish channel. Yesterday, the market opened above the levels of 1.0801 and 1.0701 with the reason for the gap. This is confirmed by the RSI indicator signaling that we are still in a bullish trending market. As the price is still above the moving average (100), immediate support is seen at 1.0801. Consequently, the first support is set at the level of 1.0801. So, the market is likely to show signs of a bullish trend around the spot of 1.0885. In other words, buy orders are recommended above the first resistance (1.0801) with the first target at the level of 1.0885. Furthermore, if the trend is able to breakout through the first resistance level of 1.0885. It should see the pair climbing towards the double top 1.0976. It would also be wise to consider where to place a stop loss; this should be set below the second support of 1.0701.
Weekly technical analysis:
- R3: 1.0976
- R2: 1.0876
- R1: 1.0801
- PP: 1.0701
- S1: 1.0626
- S2: 1.0526
- S3: 1.0451
Díky analytickým přehledům společnosti InstaForex získáte plné povědomi o tržních trendech! Jako zákazníkovi společnosti InstaForex je Vám k dispozici velký počet bezplatných služeb umožňujících efektivní obchodování.
 Zůstat