 Anuluj
Warunki handlowe
Narzędzia


The increase in the yield of 10-year US Treasury bonds above the psychologically important 3% mark and the strengthening of the dollar to its highest level since December led to a fall in gold futures quotations to the lower boundary of the medium-term consolidation range of $1300-1360 per ounce. Neither Washington's withdrawal from the 2015 nuclear agreement with Tehran, nor the ultimatum of China, nor Italy's political problems are able to change the mood of investors, who massively buy the American currency in the same way as they got rid of it in the beginning of the year. To resist the rebels from the ashes of the USD index is incredibly difficult for the precious metal.
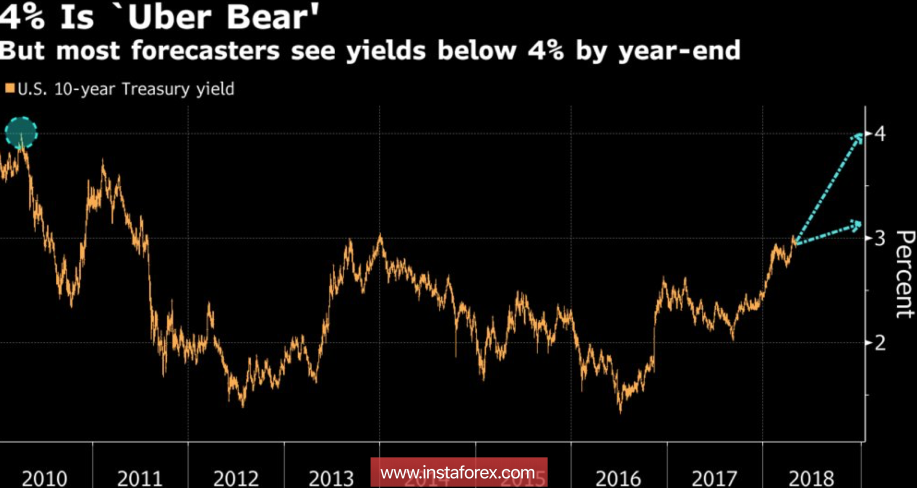
According to JP Morgan, you need to be prepared for the fact that the rates for 10-year US debt against the background of aggressive monetary tightening of the Fed will rise to 4%. Such a forecast, coupled with the statement of Central Bank chairman Jerome Powell that markets should not be frightened by a faster pace of normalization than they currently assume, if the FOMC forecasts are implemented, allows the "bears" for XAU/USD to continuously attack. Not only does the strengthening of the dollar lead to a rise in the cost of imports in the countries that are the largest consumers of the physical asset (China, India), gold also does not pay dividends and is unable to compete with securities (stocks and bonds).
Dynamics of the yield of US Treasury bonds
Nor does the precious metal receive support from the physical market. Bloomberg, referring to competent sources in new Delhi, who wished to remain anonymous, said that in April, Indian gold imports fell to 52.7 tons or 46% y/y. According to the results, in the first four months of 2018, the indicator decreased by 43% y/y and amounted to 211.7 tons. The stocks of specialized exchange funds (ETF) after the growth of 60 tons in April, which is the best indicator since February 2017, in May faced an outflow in the amount of 10.5 tons. China is not buying gold to replenish the reserves of the PBOC for the 18th consecutive month.
The withdrawal of the US from the nuclear deal with Iran boosted Brent quotes to $77 per barrel, increasing inflation expectations, which was traditionally perceived as a bullish factor for the XAU/USD. Nevertheless, while there is no clear evidence that inflation will grow faster than nominal rates on US debt, it will be difficult for gold to catch hold of the dynamics of the real yield of treasury bonds. Moreover, the market is 100% certain of a hike in the federal funds rate in June, and history shows that the precious metal tends to lose 3-4% of its value during the month preceding the significant meeting of the FOMC.
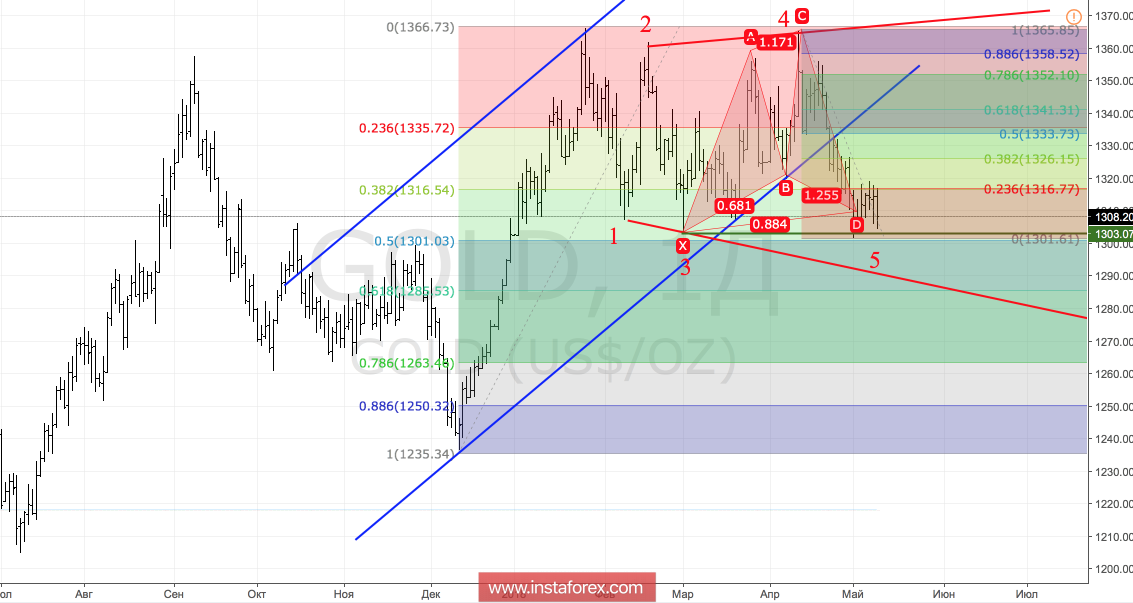
Technically, the transformation of the "Shark" pattern into 5-0 and the implementation of the "Broadening wedge" pattern continues. A repeated attack of the support at $ 1,300-1,302 per ounce will increase the risk of continuing the upward campaign in the direction of $1285 and $1263. These marks correspond to correction levels of 61.8% and 78.6% of the last medium-term upward wave.
Gold, daily chart
Dzięki analizom InstaForex zawsze będziesz na bieżące z trendami rynkowymi! Zarejestruj się w InstaForex i uzyskaj dostęp do jeszcze większej liczby bezpłatnych usług dla zyskownego handlu.


