 Anuluj
Warunki handlowe
Narzędzia


To open long positions on EURUSD, you need:
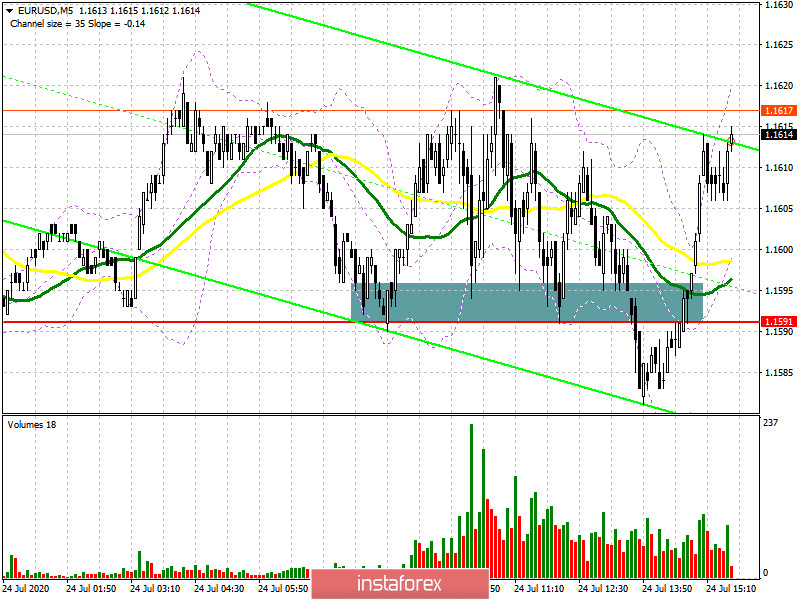
In the first half of the day, there were fairly strong data on activity in the manufacturing sector and the services sector of the Eurozone, however, they did not provide the expected support for the euro, which indicates a clear lack of desire for traders to open long positions at current highs. However, the sellers of EUR/USD were not so active, which retreated from this level after an unsuccessful attempt to break through the support of 1.1591, forming a good signal to open long positions. If you look at the 5-minute chart, you will see how the bulls held the entire European session at 1.1591 and then only temporarily released this level to collect stop orders from speculative players, quickly returning the euro to their control. At the moment, while trading is conducted above the level of 1.1591, the buyers' goal remains the resistance of 1.1647, a break of which will lead to a test of the maximum of 1.1682, where I recommend fixing the profits. Much will depend on what reports will be released on activity in the US manufacturing and services sectors. If the indicators fall short of the forecast, then a repeated test of the EUR/USD support of 1.1591 may lead to a larger decline in the pair. In this case, it is best to postpone long positions until the minimum of 1.1490 is updated. But I recommend opening long positions immediately for a rebound from the support of 1.1428 in the expectation of a correction of 25-30 points within the day.
To open short positions on EURUSD, you need:
Sellers are trying to do something, however, they lack the pressure and confidence in their actions, which is clearly visible after an unsuccessful attempt to break below the support of 1.1591. In the second half of the day, you need to wait for the release of reports on activity in the US. If the indicators turn out to be worse than economists' forecasts, the pressure on the euro may increase. However, I recommend opening short positions against the trend only after returning and fixing below the level of 1.1591. The main goal of the bears will be to return to the support level of 1.1541, the breakdown of which will lead to a larger sell-off in the area of the minimum of 1.1490, where I recommend fixing the profits. If activity reports come out better than economists' forecasts, the euro will continue to grow. In this scenario, you can count on sales only after updating the resistance at 1.1647, provided that a false breakout is formed. Or sell EUR/USD immediately on the rebound from the larger maximum of 1.1682 with the aim of correcting 25-30 points within the day.

Signals of indicators:
Moving averages
Trading is conducted in the area of 30 and 50 daily moving averages, which indicates the possible formation of a downward correction in the pair.
Note: The period and prices of moving averages are considered by the author on the hourly chart H1 and differ from the general definition of the classic daily moving averages on the daily chart D1.
Bollinger Bands
A break in the upper limit of the indicator around 1.1620 will strengthen the demand for the euro. A breakdown of the lower border in the area of 1.1580 will lead to a larger sell-off of the euro.
Description of indicators
Dzięki analizom InstaForex zawsze będziesz na bieżące z trendami rynkowymi! Zarejestruj się w InstaForex i uzyskaj dostęp do jeszcze większej liczby bezpłatnych usług dla zyskownego handlu.


