 Anuluj
Warunki handlowe
Narzędzia


The last trading day passed on a wave of long positions, during which the quote managed to update the local maximum 1.2802 ---> 1.2900, which leads to an ever greater weakening of the US dollar.
You can look for as many positive aspects as you want related to the strengthening of the pound, but there is no fundamental justification. Investors and holders of fixed assets are skeptical of the British currency, the risk of Brexit without a deal grows exponentially with each subsequent round of negotiations. We have a time bomb, where, as a result, even a weak dollar will not be able to withstand the falling pound sterling, as soon as the emotions of market participants begin to spill over the edges of speculation.
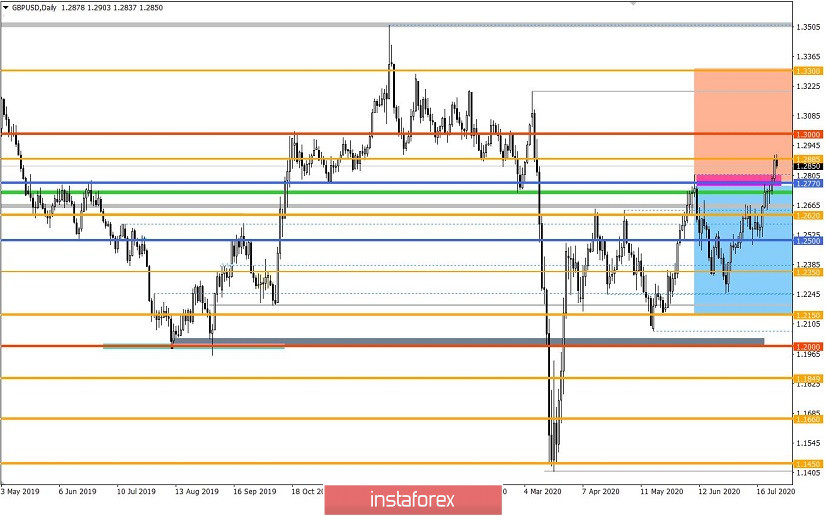
Until that moment has come, the technical justification for everything that happens seems to be quite rational. Earlier in the reviews, we have already discussed the topic of changing trading ranges 2150 // 1.2350 // 1.2620 ---> 1.2770 // 1.3000 // 1.3300. But why is this so important to the market? This difficult question can be answered by the trading chart itself, you just need to open the daily period and you will see that the area 2150 // 1.2350 // 1.2620 is psychological, and the range 1.2770 // 1.3000 // 1, 3300 - stabilizing. That is, in order to normalize the emotional mood, the market chooses the frames 1.2770 // 1.3000 // 1.3300 from year to year.
If the external background associated with Brexit, or the recovery of the UK economy does not change in any way for the better, then the above indicated range will repeat the pattern of the past, that is, it will serve as a catalyst for short positions, which will return the quote again to the area of psychological significance.
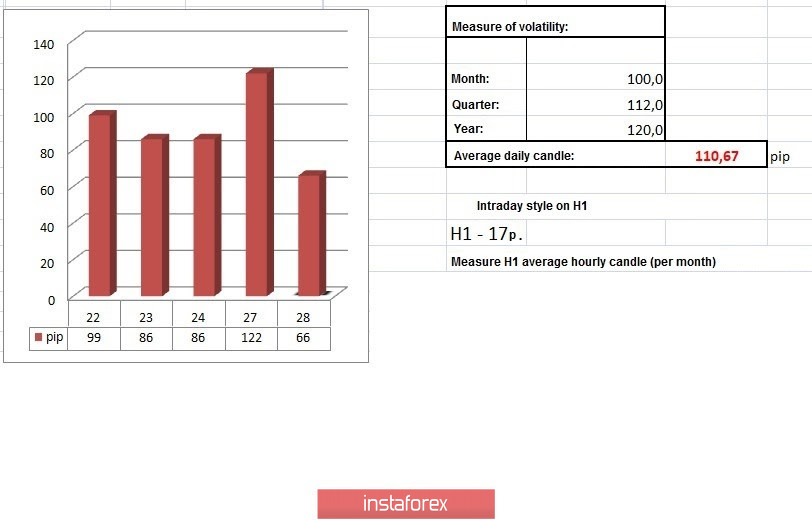
In terms of volatility, an acceleration is recorded relative to the daily average indicator by 10% (110 ---> 122 points), which signals a high speculative activity in the market.
As discussed in the previous review, traders view upward development in terms of changing market ranges, but the broadest discussion will occur after the price consolidates above the psychological level of 1.3000.
The recommendations from Monday regarding local buy operations coincided, with a small increase in the trade deposit.
[We consider positions to buy above 1.2865, towards 1.2900-1.2920]
Looking at the trading chart in general terms (daily period), a 71% recovery from the March rally can be seen.
The news background of the past day included data on orders for durable goods in the United States, which increased by 7.3% against the forecast of 5.0%. The recovery indicators are on the face, but speculators are not stopped by anything, the sell-off of the US dollar continued after a slight stop.
In terms of the information background, the discussion of noise continues: stimulation of the US/European economy, the second wave of coronavirus, as well as the lack of progress in the Brexit negotiations. Thus, speculators have something to cling to.
Today, in terms of the economic calendar, we have the S&P/CS Composite-20 in the United States, 4.0% ---> 4.1%. The indicator reflects the change in the value of residential real estate in 20 regions of the United States. It is an important indicator of the real estate market.
A high result strengthens the US dollar, while a low result weakens it.

Further development
Analyzing the current trading chart, you can see that the coordinates 1.2900 plays the role of variable resistance, relative to which there was a slowdown and as a fact of a pullback in the market. It would be most logical to see the transition from the pullback stage to the correction, in view of the strong weakening of the US dollar, but if the level of 1.2900 falls under the onslaught of speculation, then the price movement to the psychological level of 1.3000 will not be too long.
In terms of the emotional mood of the market, there is a high speculative position ratio.
It can be assumed that if the price drops below 1.2825, then the retracement may be transformed into a correction towards 1.2770. Otherwise, price fluctuations may occur within the level of 1.2885, where consolidates above 1.2900 will lead to a subsequent upward move.
Indicator analysis
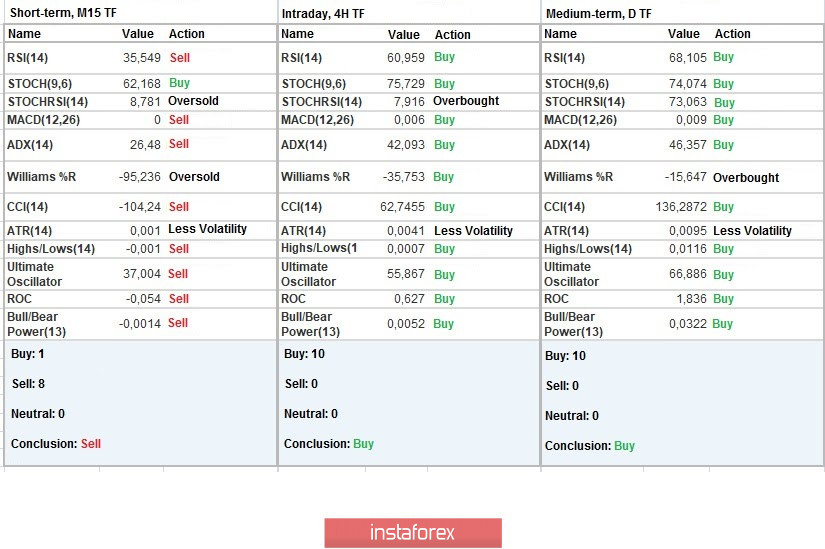
Analyzing different sectors of time frames (TF), we see that the indicators of technical instruments on one-minute periods signal a sell due to the pullback process. Meanwhile, hourly and daily intervals signal a buy, due to the rapid upward movement of the price in the period earlier.
Weekly volatility / Volatility measurement: Month; Quarter; Year
Measurement of volatility reflects the average daily fluctuation, calculated per Month / Quarter / Year.
(July 28 was built taking into account the publication time of the article)
The volatility of the current time is 66 points, which is 40% lower than the daily average. Speculative excitement is still taking place in the market, which means that an increase in volatility is possible in the market.
Key levels
Resistance zones: 1.2885 *; 1.3000; 1.3170 **; 1.3300 **; 1.3600; 1.3850; 1.4000 ***; 1.4350 **.
Support zones: 1.2770 **; 1.2620; 1.2500; 1.2350 **; 1.2250; 1.2150 **; 1.2000 *** (1.1957); 1.1850; 1.1660; 1.1450 (1.1411); 1.1300; 1.1000; 1.0800; 1.0500; 1.0000.
* Periodic level
** Range level
*** Psychological leve
Dzięki analizom InstaForex zawsze będziesz na bieżące z trendami rynkowymi! Zarejestruj się w InstaForex i uzyskaj dostęp do jeszcze większej liczby bezpłatnych usług dla zyskownego handlu.


