 Anuluj
Warunki handlowe
Narzędzia


To open long positions on EURUSD, you need:
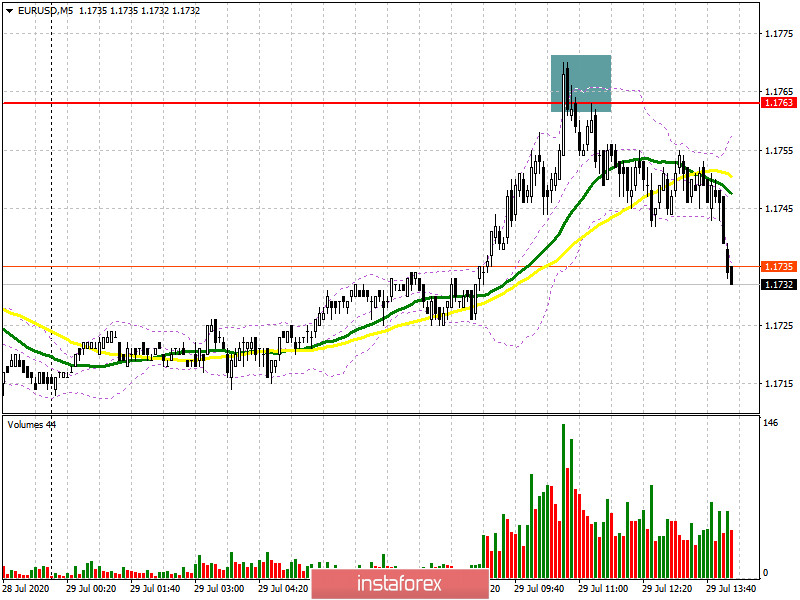
In the first half of the day, the bears managed to form a good signal to sell the euro with the formation of a false breakout in the resistance area of 1.1763, which I paid attention to in my morning forecast. If you look at the 5-minute chart, you will see how sellers do not let the euro above 1.1763 and then retest this level from the bottom up to form a good entry point. Now the focus has shifted to the Federal Reserve meeting, which will determine the future direction of the euro. In the second half of the day, the bulls will try to regain the resistance of 1.1763, but only very unexpected news from the Fed on the expansion of the bond repurchase program or changes in interest rates will allow the bulls to gain a foothold above this range, which forms a good point for moving into long positions. In this scenario, you can expect to update the weekly maximum in the area of 1.1802, as well as a test of a longer-term resistance of 1.1830, where I recommend fixing the profits. If the pressure on EUR/USD returns in the second half of the day, then the bulls will have to protect the support of 1.1704. However, I recommend opening long positions from there only after forming a false breakout. It is best to buy euros immediately on a rebound from the minimum of 1.1648 in the expectation of a correction of 25-30 points within the day.
To open short positions on EURUSD, you need:
Bears have already formed a good selling point for the euro and many have taken advantage of it. Now the focus has shifted to the new level of 1.1704, where the lower border of the Bollinger indicator passes. Only fixing below this range will be an additional signal to open short positions in the expectation of a decrease in EUR/USD to a minimum of 1.1648. A more distant goal will be the area of 1.1591, where I recommend fixing the profits. If the pair returns to the resistance area of 1.1763, then only the formation of a false breakout there will be a signal to open short positions in the euro. If there is no activity on the part of sellers in the area of 1.1763, I recommend to postpone sales until the update of the maximum of 1.1802 or even sell EUR/USD immediately on the rebound from the resistance of 1.1830.
Signals of indicators:
Moving averages
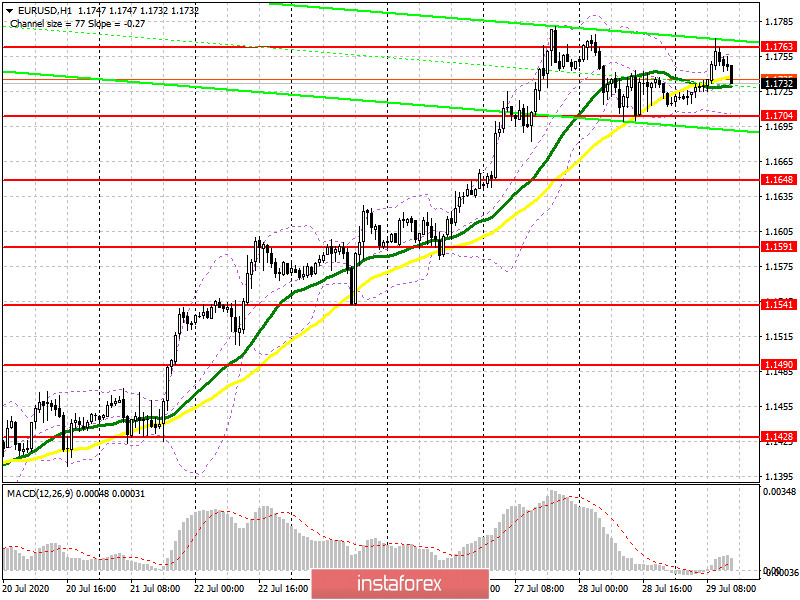
Trading is conducted in the area of 30 and 50 daily moving averages, which indicates market uncertainty in the short term.
Note: The period and prices of moving averages are considered by the author on the hourly chart H1 and differ from the general definition of the classic daily moving averages on the daily chart D1.
Bollinger Bands
A break in the upper limit of the indicator around 1.1763 will strengthen the demand for the euro. A breakdown of the lower border of the indicator in the area of 1.1704 will lead to a larger downward correction of the pair.Description of indicators
Dzięki analizom InstaForex zawsze będziesz na bieżące z trendami rynkowymi! Zarejestruj się w InstaForex i uzyskaj dostęp do jeszcze większej liczby bezpłatnych usług dla zyskownego handlu.


