Informacje te są częścią komunikacji marketingowej i są przeznaczone dla klientów detalicznych i profesjonalnych. Informacje te nie zawierają i nie powinny być interpretowane jako informacje zawierające porady inwestycyjne lub rekomendacje dotyczące inwestycji, a także oferty lub zaproszenia do udziału w dowolnej transakcji, lub strategii dotyczącej instrumentów finansowych. Wcześniejsze zyski nie stanowią gwarancji przyszłych dochodów. Instant Trading EU Ltd nie udziela żadnych gwarancji i nie ponosi żadnej odpowiedzialności za dokładność lub kompletność dostarczonych informacji, a także za jakiekolwiek straty wynikające z inwestycji opartych na analizie, prognozie lub innych informacjach dostarczonych przez pracownika Firmy, lub w jakikolwiek inny sposób. Pełne oświadczenie o wyłączeniu odpowiedzialności jest dostępne tutaj.
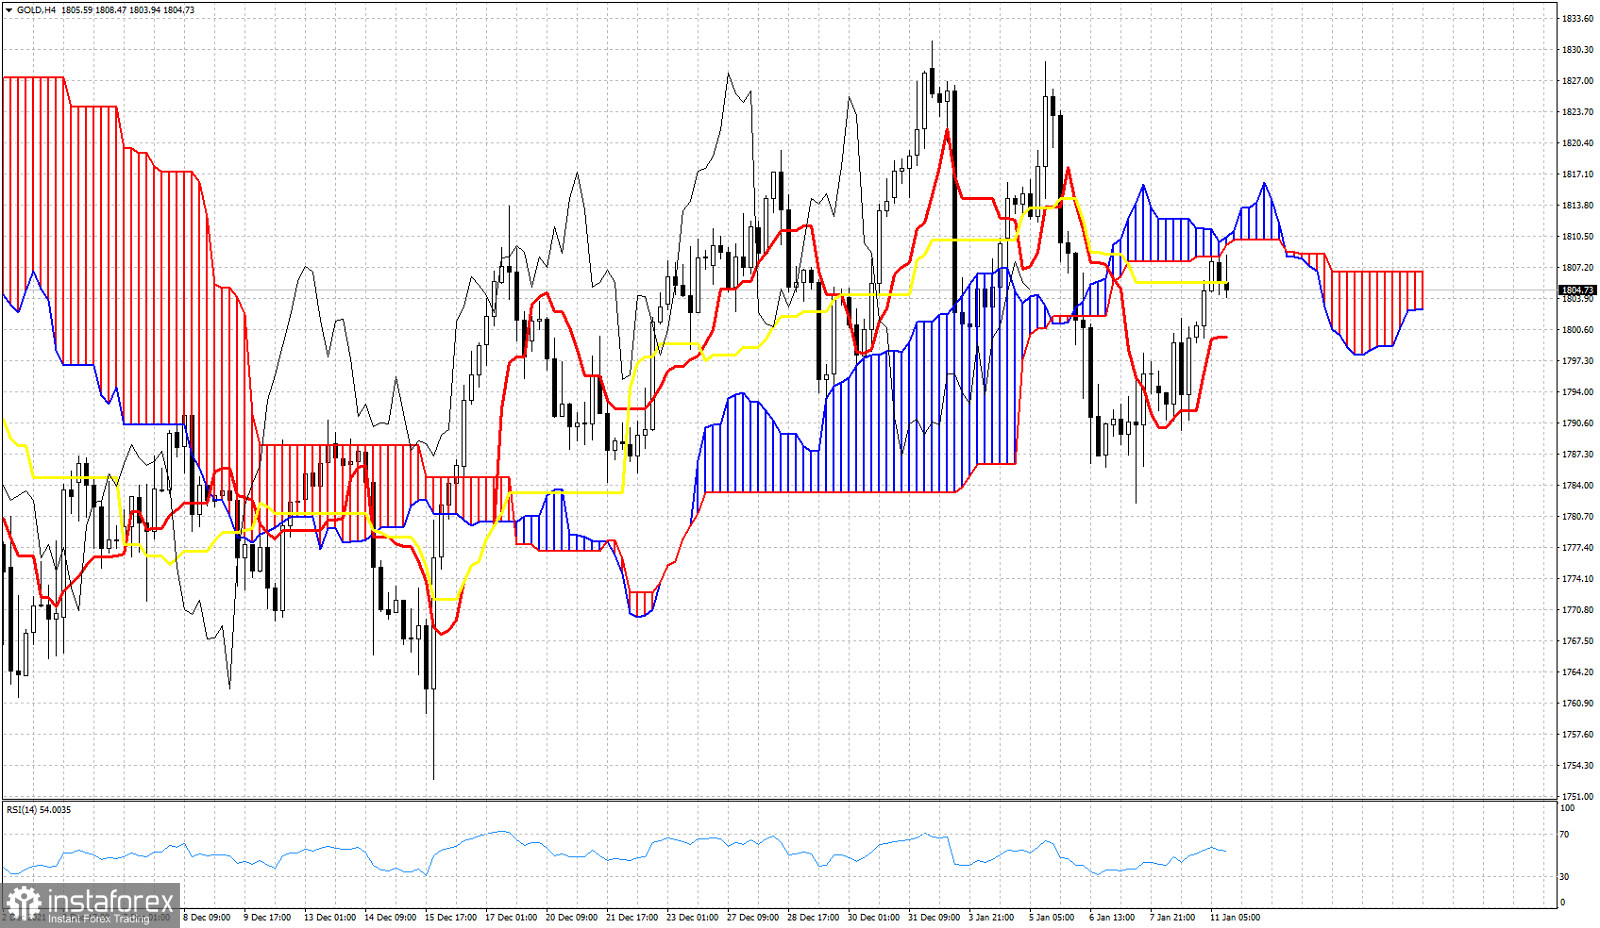
Gold bulls managed to push price back above $1,850 but the Ichimoku cloud indicator shows that they only managed to test the cloud resistance in the 4 hour chart. Price is showing rejection signs at the cloud resistance and this implies that Gold price formed a lower high and should prepare for a lower low too.
![Exchange Rates 11.01.2022 analysis]()
In the 4 hour chart Gold price is below the Ichimoku cloud. This is a sign of weakness. Support by the tenkan-sen is at $1,800 and a break below this level will be an added sign of weakness.The Kijun-sen (yellow line indicator) is still above the tenkan-sen (red line indicator). A crossing of the kijun-sen below the tenkan-sen will be a sell signal. This will happen if Gold price fails to stay above $1,800 and eventually breaks below $1,790. The Chikou span (black line indicator) is below the candlestick pattern, implying that we should still consider this as a relief bounce and that the down trend shall resume its course. Bulls need to defend $1,790-$1,800 and break above $1,810. For now there is no bullish sign in the 4 hour chart.
Otwórz konto handlowe w InstaForex
Dzięki analizom InstaForex zawsze będziesz na bieżące z trendami rynkowymi! Zarejestruj się w InstaForex i uzyskaj dostęp do jeszcze większej liczby bezpłatnych usług dla zyskownego handlu.
 Anuluj