 Anuluj
Warunki handlowe
Narzędzia

Back in December we posted analysis on Goldman Sachs stock price. At that time, we warned bulls that the up trend was nearly completed if not already complete and that a change in trend was imminent. Price had support at $372 which were broken on a daily basis. Price bounced but never hit our bearish stop.
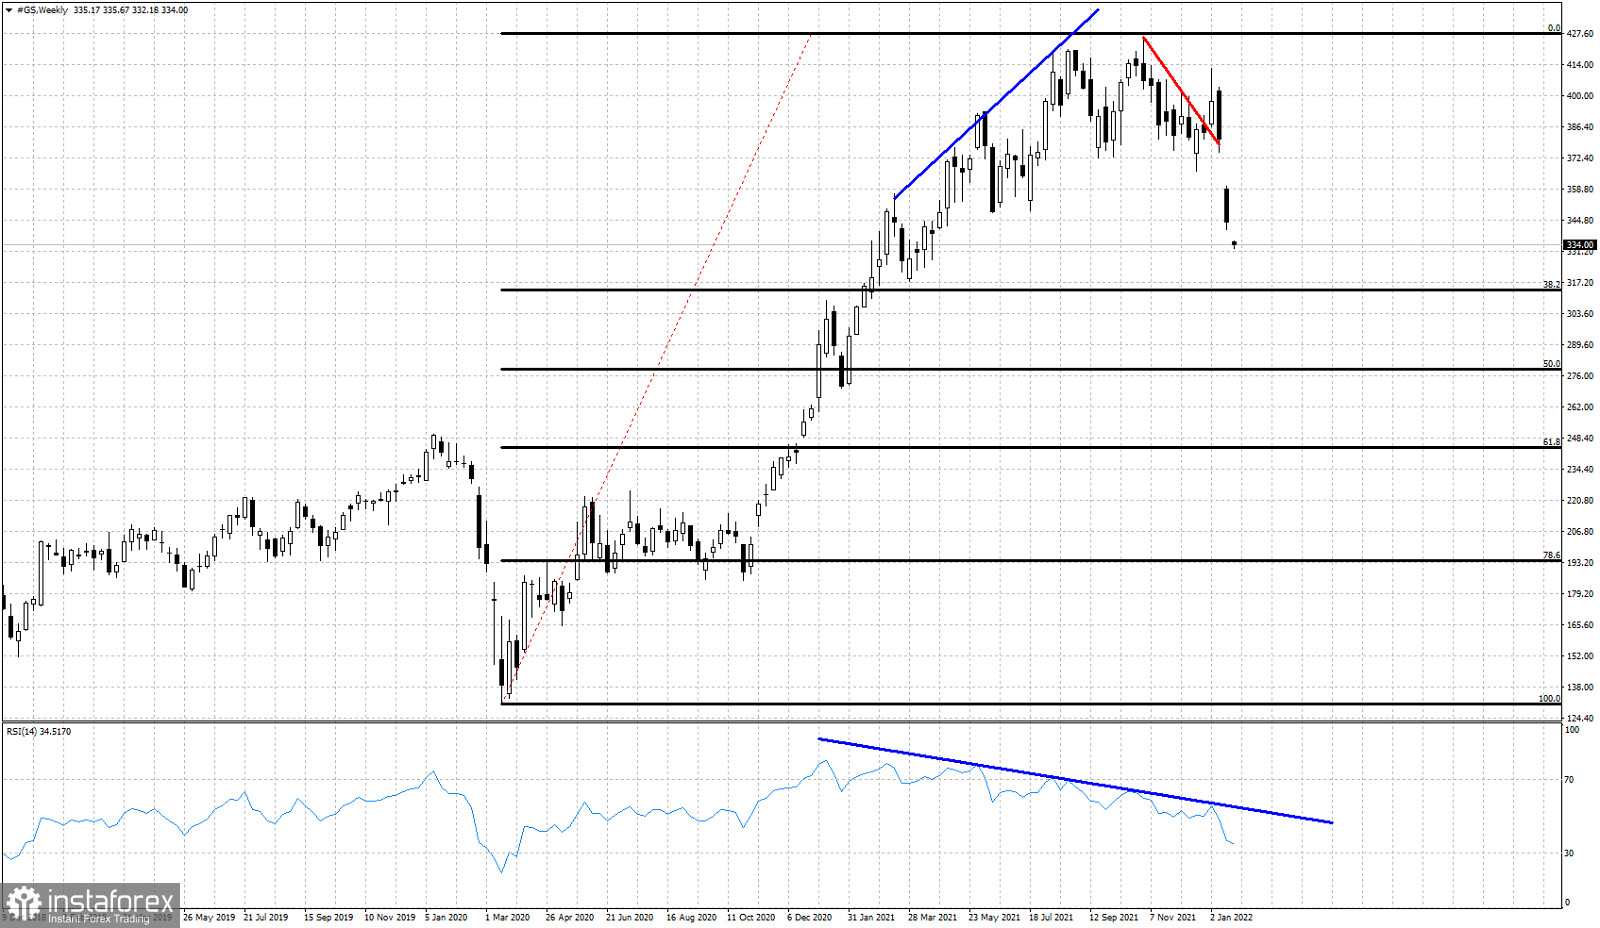
Black lines- Fibonacci retracement
Red line -short-term resistance
The price action over the last two weeks in GS stock price has been horrible for bulls. Price declined from $400 to $333. We are very close to our first pull back target of $310 where we find the 38% Fibonacci retracement. The RSI just entered oversold levels on a daily basis. Price could bounce higher this week but overall I expect prices to continue lower.
Dzięki analizom InstaForex zawsze będziesz na bieżące z trendami rynkowymi! Zarejestruj się w InstaForex i uzyskaj dostęp do jeszcze większej liczby bezpłatnych usług dla zyskownego handlu.


