 Anuluj
Warunki handlowe
Narzędzia


Trend analysis.
This week, the price is expected to increase from the level of 1.2743 (closing of the last weekly candlestick) in order to reach the pullback level of 38.2% - 1.2980 (blue dotted line). If this line is broken upwards, we can continue to further rise with the goal of the 50.0% pullback level - 1.3076 (blue dashed line).
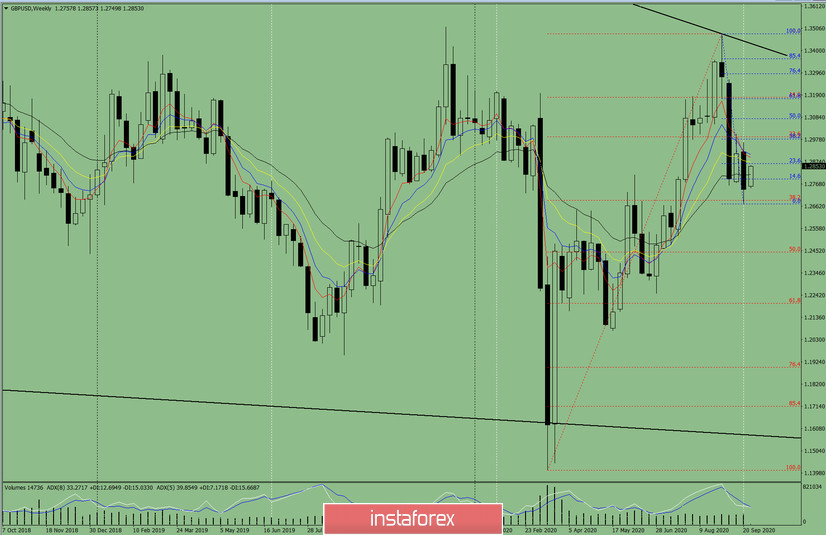
Figure: 1 (weekly chart).
Comprehensive analysis:
- indicator analysis - up;
- Fibonacci levels - up;
- volumes - up;
- candlestick analysis - up;
- trend analysis - up;
- Bollinger lines - up;
- monthly chart - up.
An upward movement can be concluded based on a comprehensive analysis.
The general result of calculating the candlestick of the GBP/USD pair according to the weekly chart: the price is likely to have an upward trend this week without the first lower shadow of the weekly white candlestick (Monday - up) and with the second upper shadow (Friday - down).
The first upper target is a pullback level of 23.6% - 1.2862 (blue dashed line). In case of breaking this line up, we can continue to further rise towards the target of the pullback level of 38.2% - 1.2980 (blue dotted line).
An unlikely scenario: when moving up and testing the pullback level of 23.6% - 1.2862 (blue dotted line), it is unlikely that the price will decline, with the goal of the lower fractal - 1.2673 (blue dotted line).
Dzięki analizom InstaForex zawsze będziesz na bieżące z trendami rynkowymi! Zarejestruj się w InstaForex i uzyskaj dostęp do jeszcze większej liczby bezpłatnych usług dla zyskownego handlu.


