 Anuluj
Warunki handlowe
Narzędzia


Trend analysis
The price from the level of 1.1573 (closing of the last weekly candle) may start rising to the target of 1.1636 – the pullback level of 14.6% (blue dotted line) this week. After breaking through this level up, it may further rise to the target of 1.1702 – the pullback level of 23.6% (blue dotted line).
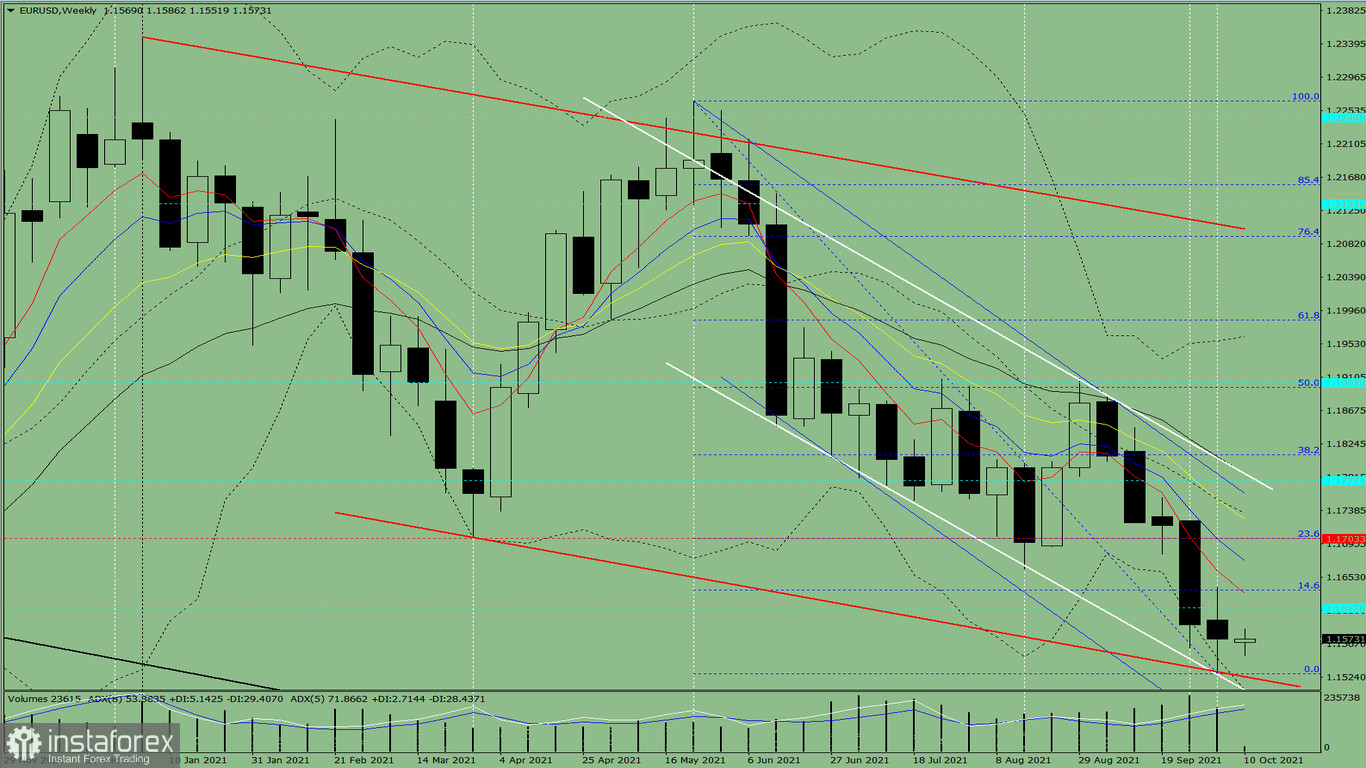
Figure (weekly chart)
Comprehensive analysis:
An upward movement can be concluded based on a comprehensive analysis.
The overall result of the candlestick calculation based on the weekly chart: the price will most likely move in an upward trend, without a lower shadow (Monday - up) and with an upper shadow (Friday - down) in the weekly white candlestick.
The price from the level of 1.1573 (closing of the last weekly candle) may begin its growth to the target of 1.1636 – the pullback level of 14.6% (blue dotted line) this week. If this level is broken up, the upward movement may continue to the target of 1.1702 – the pullback level of 23.6% (blue dotted line).
Alternatively, the price from the level of 1.1573 (closing of the last weekly candle) may continue to rise to test the historical resistance level of 1.1614 (blue dotted line). After reaching this level, a decline is possible with the target of 1.1529 – a lower fractal (blue dotted line).
Dzięki analizom InstaForex zawsze będziesz na bieżące z trendami rynkowymi! Zarejestruj się w InstaForex i uzyskaj dostęp do jeszcze większej liczby bezpłatnych usług dla zyskownego handlu.


