 Anuluj
Warunki handlowe
Narzędzia


Here are the details of the economic calendar for October 15:
The retail sales data in the United States was released last Friday, whose growth rate slowed down from 15.4% to 13.95%. This is not the best factor. A detailed review of statistics shows that the previous data was revised in favor of growth from 15.1% to 15.4%, and the forecast for the current recession was several times worse than 9%.
As a result, expectations diverged, and the US dollar received local support.
* The volume of retail sales is one of the main economic indicators, which is an indicator of the change in sales volume in the context of retail trade. In simple words, this indicator reflects the purchasing power of the population.
Analysis of trading charts from October 15:
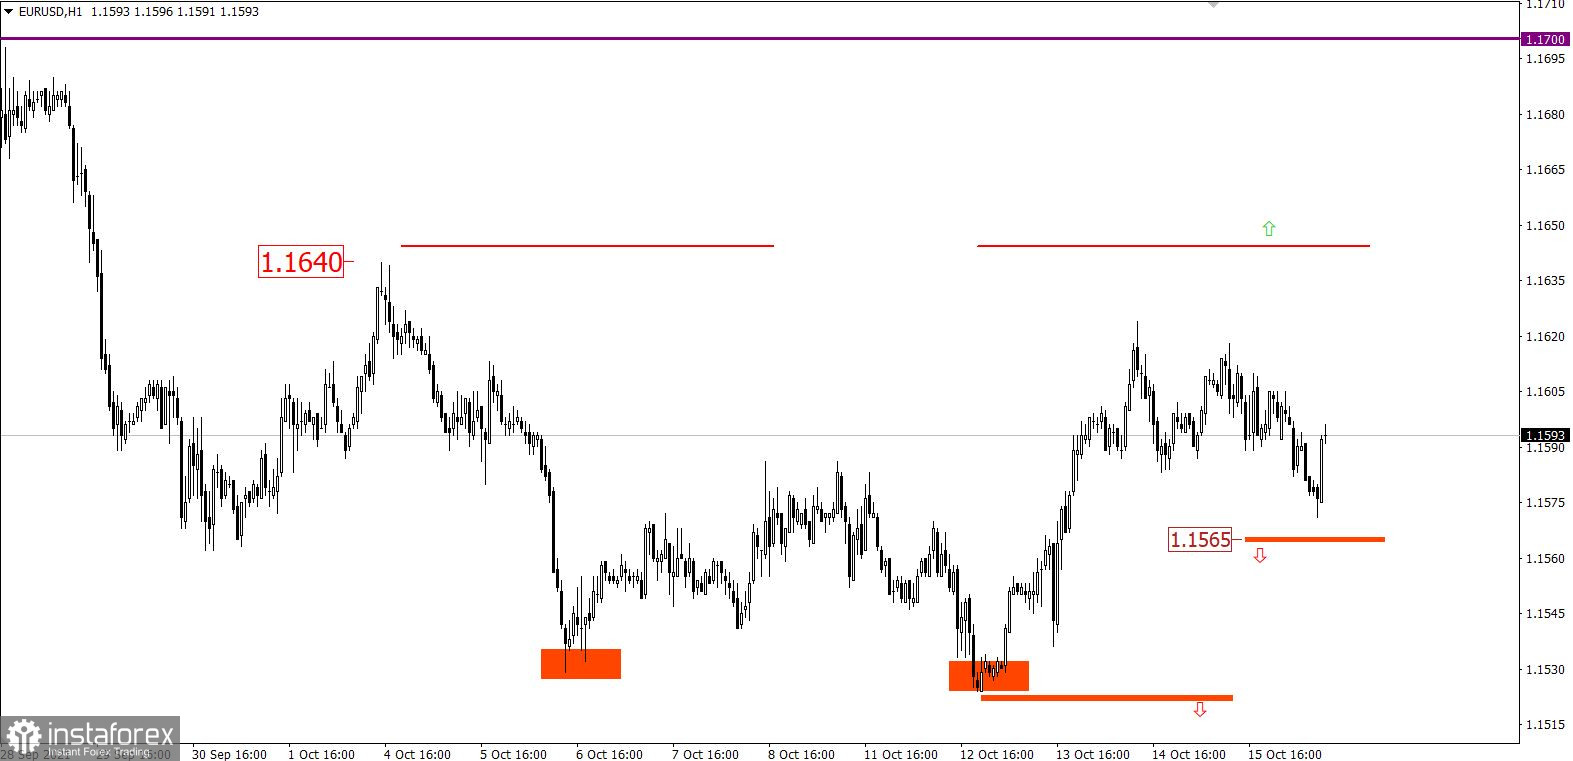
The EUR/USD pair completed the correction in the area of 1.1624 level, where a pullback occurred after the sideways channel in the range of 1.1580/1.1624. The local high from October 4 serves as the main resistance level, relative to which there was a reduction in the volume of long positions.
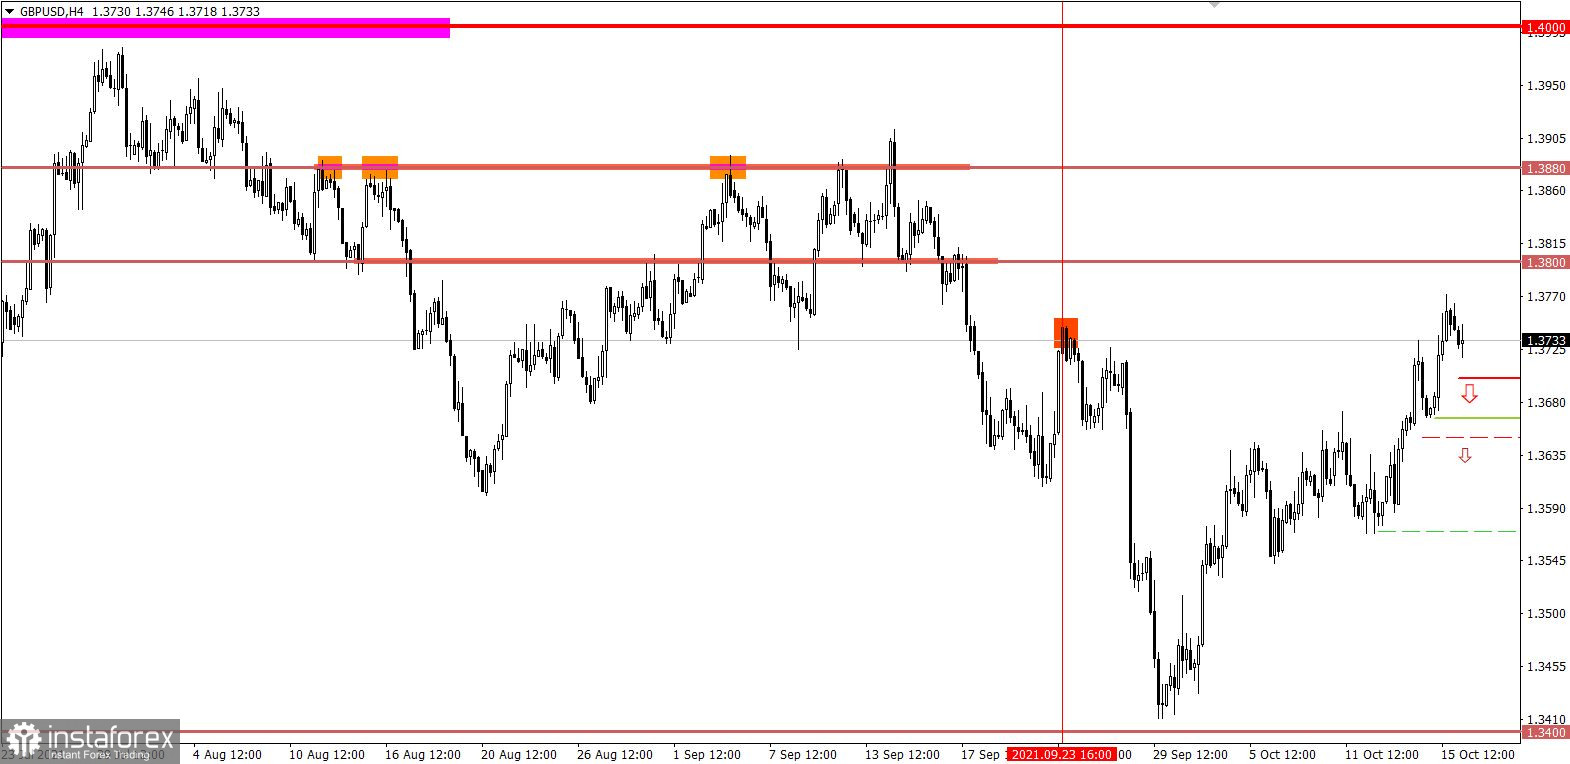
The GBP/USD pair slowed down the upward movement in the area of the local high on September 23, where a slight pullback occurred.
Analyzing the above currency pairs, the US dollar is in a local sell-off stage.

October 18 economic calendar:
Today, the US data on industrial production is expected to be published, where their volume may decline from 5.9% to 5.8% in annual terms.
Industrial production reflects the change in production volumes at enterprises in the reporting period. The calculation of the indicator takes into account all branches of production: industry, mining, and processing of minerals, energy production, water resources, and waste management.
Trading plan for EUR/USD on October 15:
During the start of the European session, the lower border of the side channel 1.1580/1.1624 was locally broken, but as a result, the quote returned to its original position. It can be assumed that there is a process of accumulation of trade forces, which will lead to a natural acceleration in the market.
In this situation, the best trading tactic is to keep the price outside the control values.
Trading plan for GBP/USD on October 18:
It can be assumed that the price area of 1.3640/1.3650 still serves as a resistance in the market, otherwise, there would be no current stagnation towards correction. Thus, it is worth considering the possibility of ending the correction if the price holds below the level of 1.3700.
If expectations coincide, the pound may gradually weaken in the market. This will lead to a price decline towards the low of October 15. After that, traders will focus on the next step from the level of 1.3650 towards 1.3610 -1.3570.
What is reflected in the trading charts?
A candlestick chart view is graphical rectangles of white and black light, with sticks on top and bottom. When analyzing each candle in detail, you will see its characteristics of a relative period: the opening price, closing price, and maximum and minimum prices.
Horizontal levels are price coordinates, relative to which a stop or a price reversal may occur. These levels are called support and resistance in the market.
Circles and rectangles are highlighted examples where the price of the story unfolded. This color selection indicates horizontal lines that may put pressure on the quote in the future.
The up/down arrows are the reference points of the possible price direction in the future.
Dzięki analizom InstaForex zawsze będziesz na bieżące z trendami rynkowymi! Zarejestruj się w InstaForex i uzyskaj dostęp do jeszcze większej liczby bezpłatnych usług dla zyskownego handlu.


