 Anuluj
Warunki handlowe
Narzędzia


Here are the details of the economic calendar for October 26:
Yesterday, the US statistics were published, which were not considered super-important, but still put pressure on the market. So, the house price index was published during the American session, where instead of growth from 19.9% to 20.1%, a decline was recorded with the revision of previous data from 19.2% to 18.5%. The divergence of expectations did not disappoint the US dollar, as data on the sale of new housing were released along the way, which reflected the strongest growth in the September period by 14%.
As a result, the value of the US dollar strengthened locally.
Analysis of trading charts from October 26:
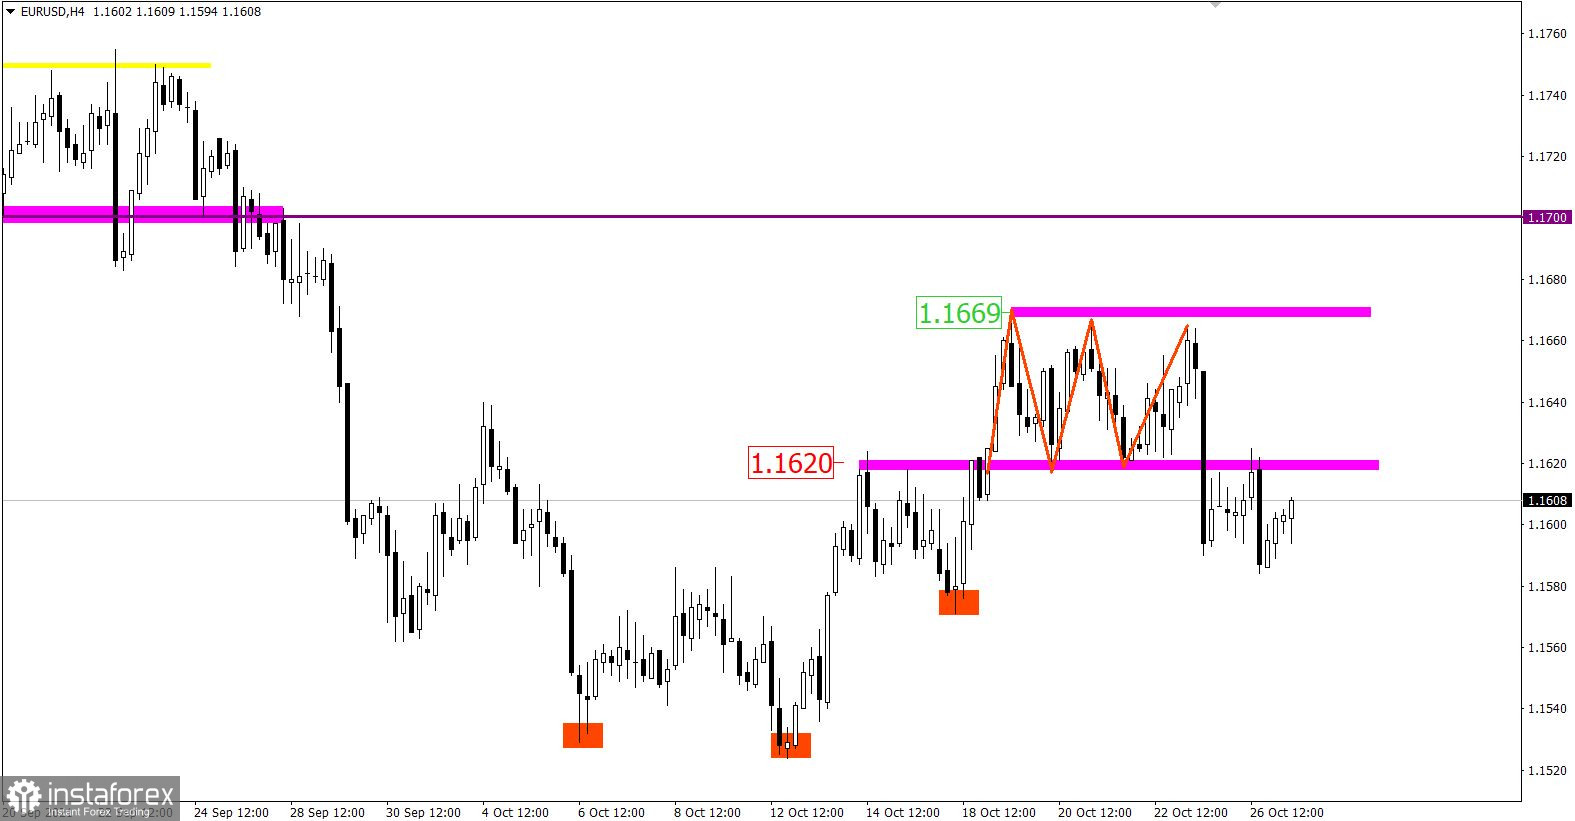
The EUR/USD pair is moving below the previously broken side channel of 1.1620/1.1669, which may signal a prevailing interest in a downward move. At the same time, market participants failed to fully restore the volume of short positions, which led to a slight stop.
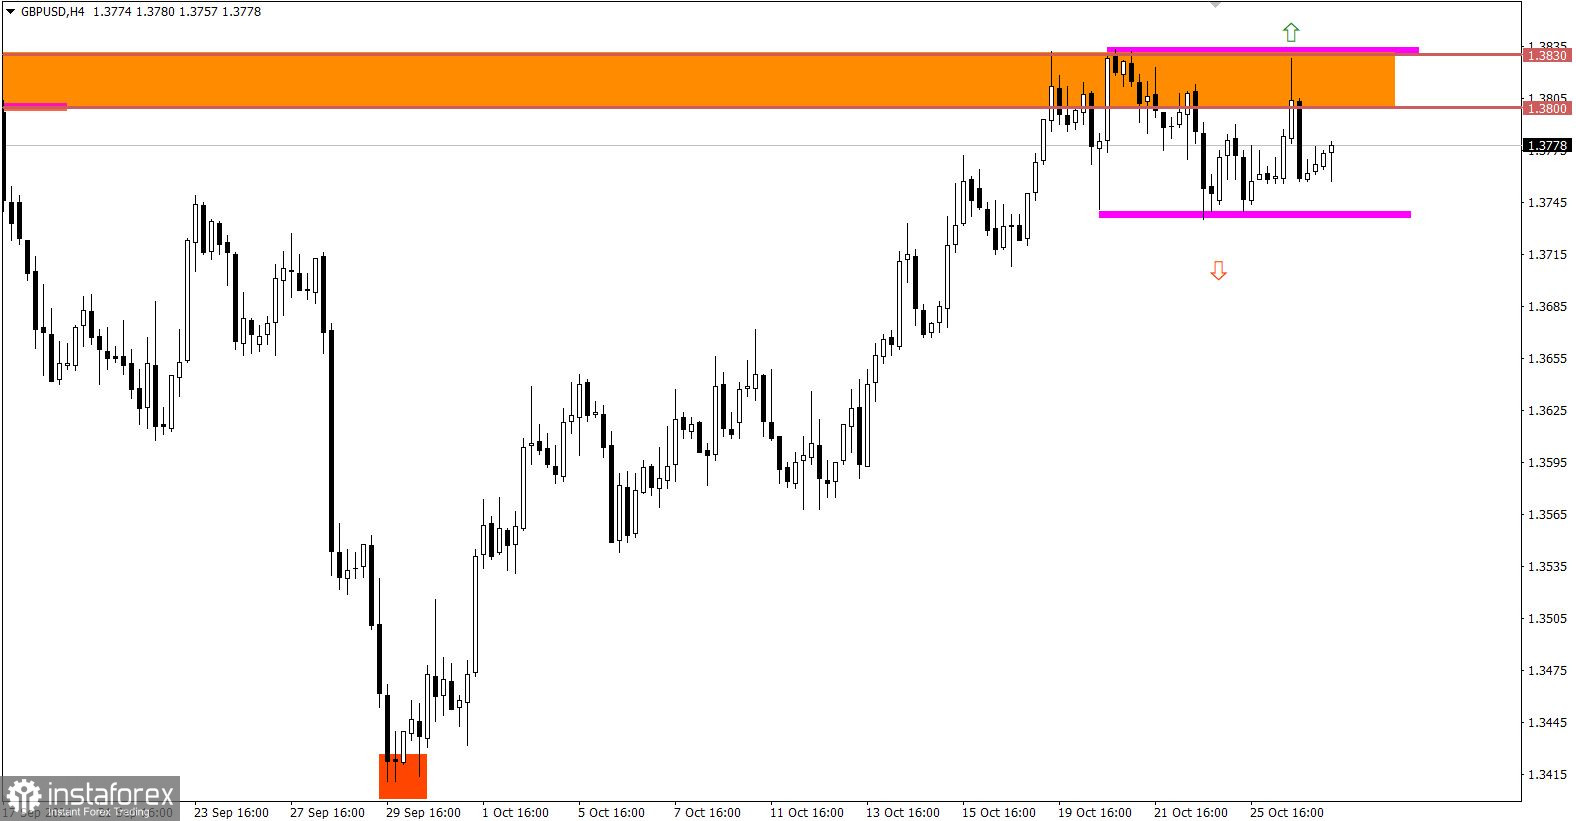
For the GBP/USD pair, a side channel in the range of 1.3730/1.3830 has replaced the correction move from the support point of 1.3400, where a quote follows for more than a week.
It should not be forgotten that there is a downward trend in the market from the beginning of June despite the scale of the correction.

October 27 economic calendar:
The data on durable goods will be published today, where their volume may decrease by -1.1% during September, which is considered not the best signal for the economy. So if expectations coincide, the US dollar may well be under pressure from sellers.
Trading plan for EUR/USD on October 27:
In this situation, the price stop at 1.1590 / 1.1625 may hold back sellers for some time. A signal for a further increase in the volume of short positions will come when the price is kept below 1.1580.
Trading plan for GBP/USD on October 27:
The side channel in the range of 1.3730/1.3830 is still relevant in the market. It can be assumed that there is a process of accumulation of trading forces, which will lead to a natural acceleration in the market.
In this case, the best trading tactic is the method of breaking through one or another border of the established range.
What is reflected in the trading charts?
A candlestick chart view is graphical rectangles of white and black light, with sticks on top and bottom. When analyzing each candle in detail, you will see its characteristics of a relative period: the opening price, closing price, and maximum and minimum prices.
Horizontal levels are price coordinates, relative to which a stop or a price reversal may occur. These levels are called support and resistance in the market.
Circles and rectangles are highlighted examples where the price of the story unfolded. This color selection indicates horizontal lines that may put pressure on the quote in the future.
The up/down arrows are the reference points of the possible price direction in the future.
Dzięki analizom InstaForex zawsze będziesz na bieżące z trendami rynkowymi! Zarejestruj się w InstaForex i uzyskaj dostęp do jeszcze większej liczby bezpłatnych usług dla zyskownego handlu.


