 Anuluj
Warunki handlowe
Narzędzia


Breaking news from the crypto space:
What is the probability of BTC/USD falling to the level of $ 30,000? In contrast to bullish expectations this year, the prices of Bitcoin continue to decline. Now that the first cryptocurrency is hovering around $ 40,000, market participants are asking themselves the same question: where will the price be more likely to move – to $ 50,000 or $ 30,000? If Bitcoin closes the week below $ 40,000, there will be a chance of testing support at $ 30,000 in the medium term. In turn, a decisive reversal around the $ 40,000 level could support BTC's rally.
It can be seen that the movement is very similar to the price's behavior in February-May last year when it reached four highs and the relative strength index formed lower highs. Four price highs with lows highs, together with the RSI mimicking a similar downward trend, triggered a decline in BTC to $ 30,000 last May.
Now, let's continue to consider Bitcoin from the viewpoint of the Elliott theory on the hourly timeframe.
BTC/USD, H1 timeframe:
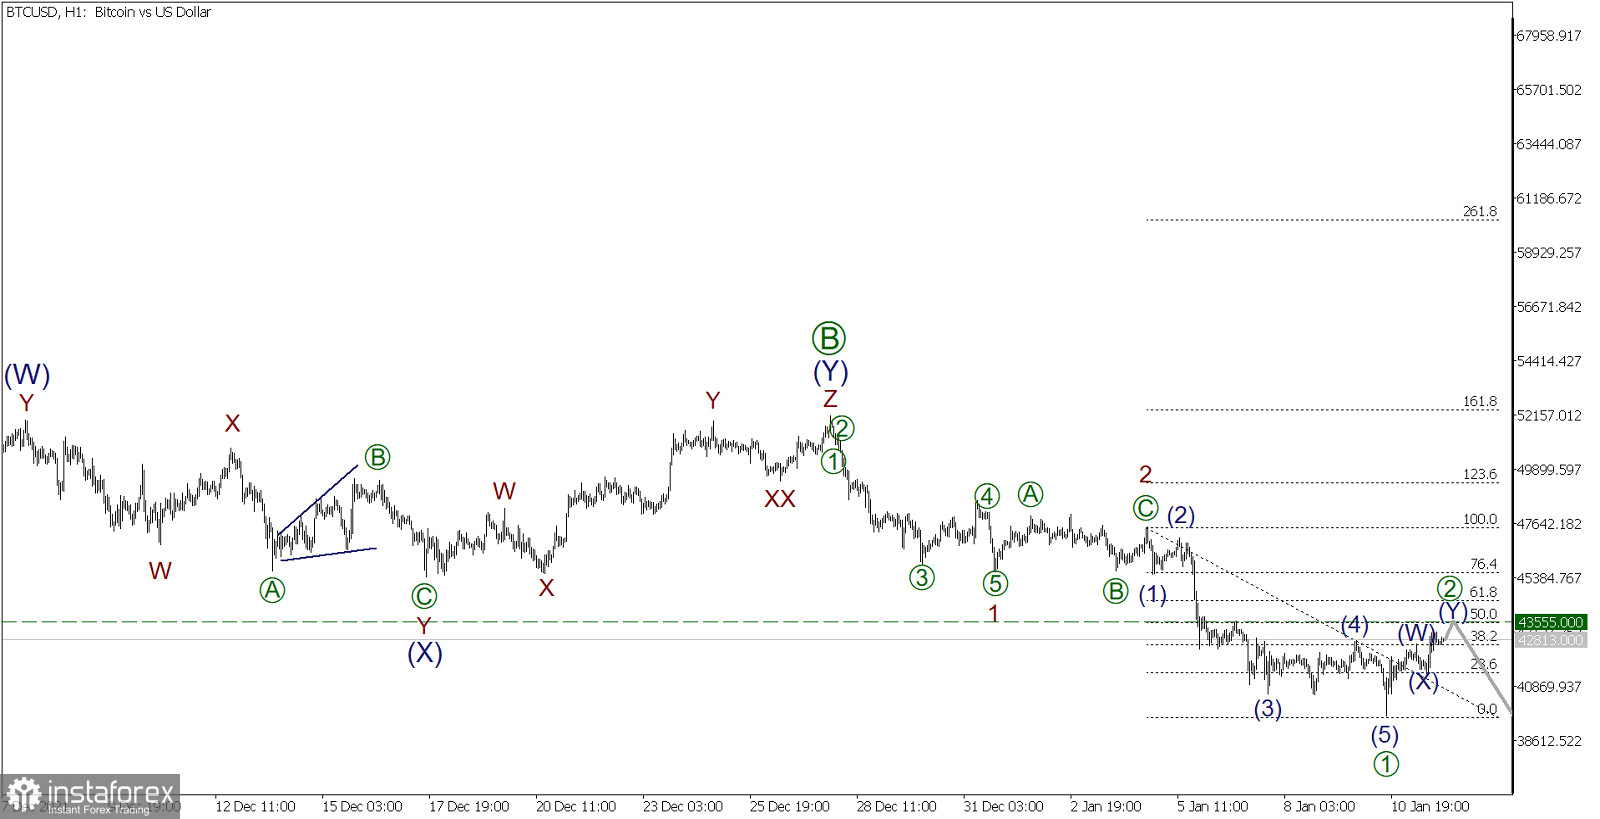
To confirm the above information, let's see the wave analysis of the cryptocurrency pair. It can be seen that a downward trend is being built in the market. According to Elliott's theory, a large bearish zigzag [A]-[B]-[C] is formed, in which the correction wave [B], which is its middle part, was completed. Now, we see the formation of the initial part of the final wave [C].
The initial part of wave [C] hints at an impulse. Currently, sub-waves 1 and 2 are already done. The third impulse sub-wave is in the process of development, which is expected to be stronger than the previous two sub-waves.
Most likely, the price completed the development of the downward sub-wave [1], which took the form of an impulse (1)-(2)-(3)-(4)-(5), and then began to build an upward correction [2] to this impulse.
Moreover, it seems that the correctional wave [2] is almost completed. It looks like a double zigzag (W)-(X)-(Y), which may end around the level of 43555.00l. At this level, the value of wave [2] will be 50% along the Fibonacci lines of the impulse [1].
The probability of reaching this level is high. Bitcoin will further decline to lower levels after the end of the correction [2].
Dzięki analizom InstaForex zawsze będziesz na bieżące z trendami rynkowymi! Zarejestruj się w InstaForex i uzyskaj dostęp do jeszcze większej liczby bezpłatnych usług dla zyskownego handlu.


