 Anuluj
Warunki handlowe
Narzędzia


Yesterday was a day off in Europe on the occasion of Easter, so the financial sectors were closed. Thus, trading volumes were reduced, which negatively affected volatility.
Despite the empty macroeconomic calendar, discussions continue to flare up in the media regarding the tightening of the Fed's monetary policy. We have repeatedly heard statements that the interest rate will rise at a high rate, at 0.5% per meeting.
In his speech yesterday, St. Louis Fed President James Bullard said that he is in favor of a rate increase of 0.75% at once.
The main theses of the speech:
- we need to act right now, we need to act faster
- 3.5% is the minimum rate the Fed needs to fight inflation; the Fed will try to reach this level by the end of this year
- does not exclude the Fed rate hike by 0.75% immediately
- hopes that the Fed will start reducing the balance sheet from the next meeting
- the Fed could start cutting the balance sheet faster if inflation doesn't respond properly to monetary policy
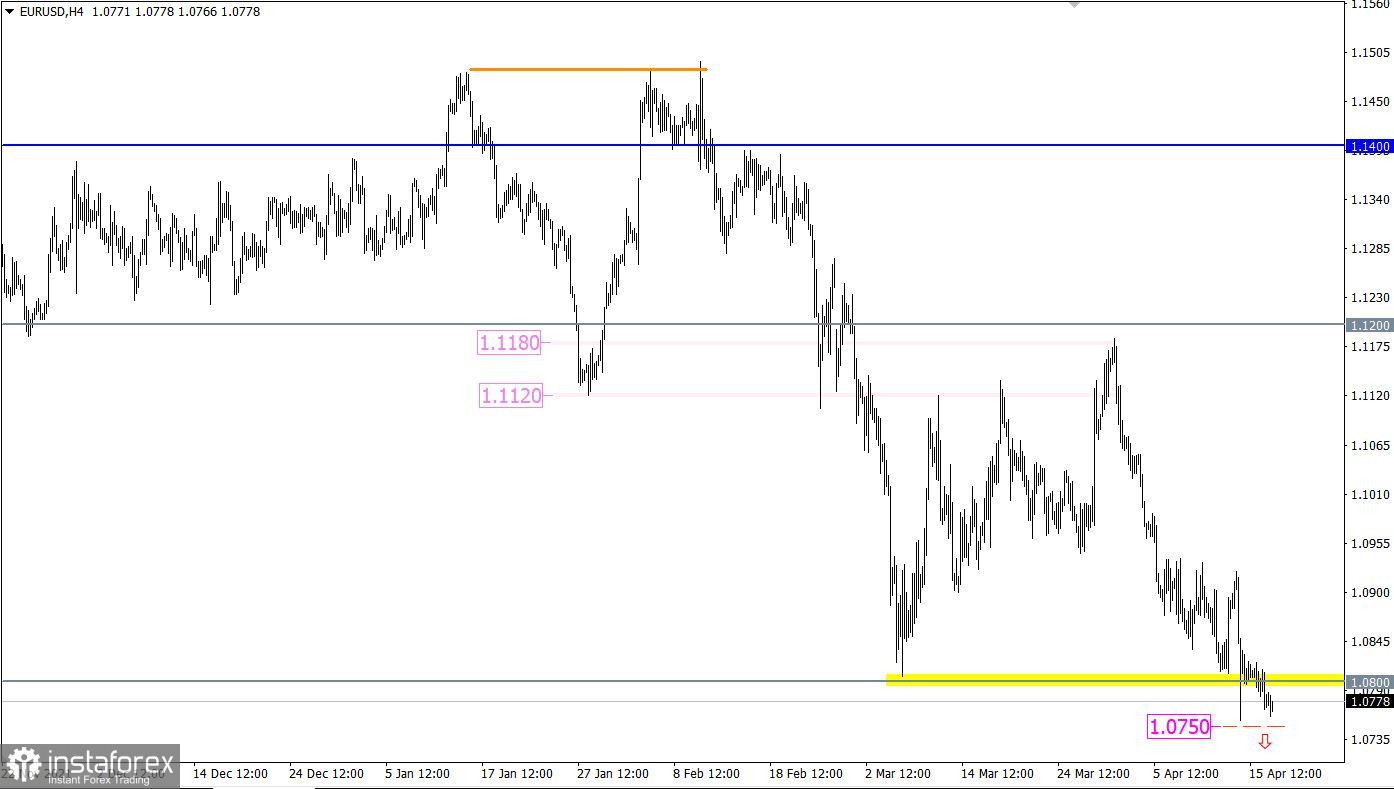
The EURUSD currency pair is at the stage of prolongation of the medium-term downward trend. This is indicated by a number of technical factors: the completion of the corrective move, the breakdown of the support level of 1.0800, and the price holding below the reference level in a four-hour period.
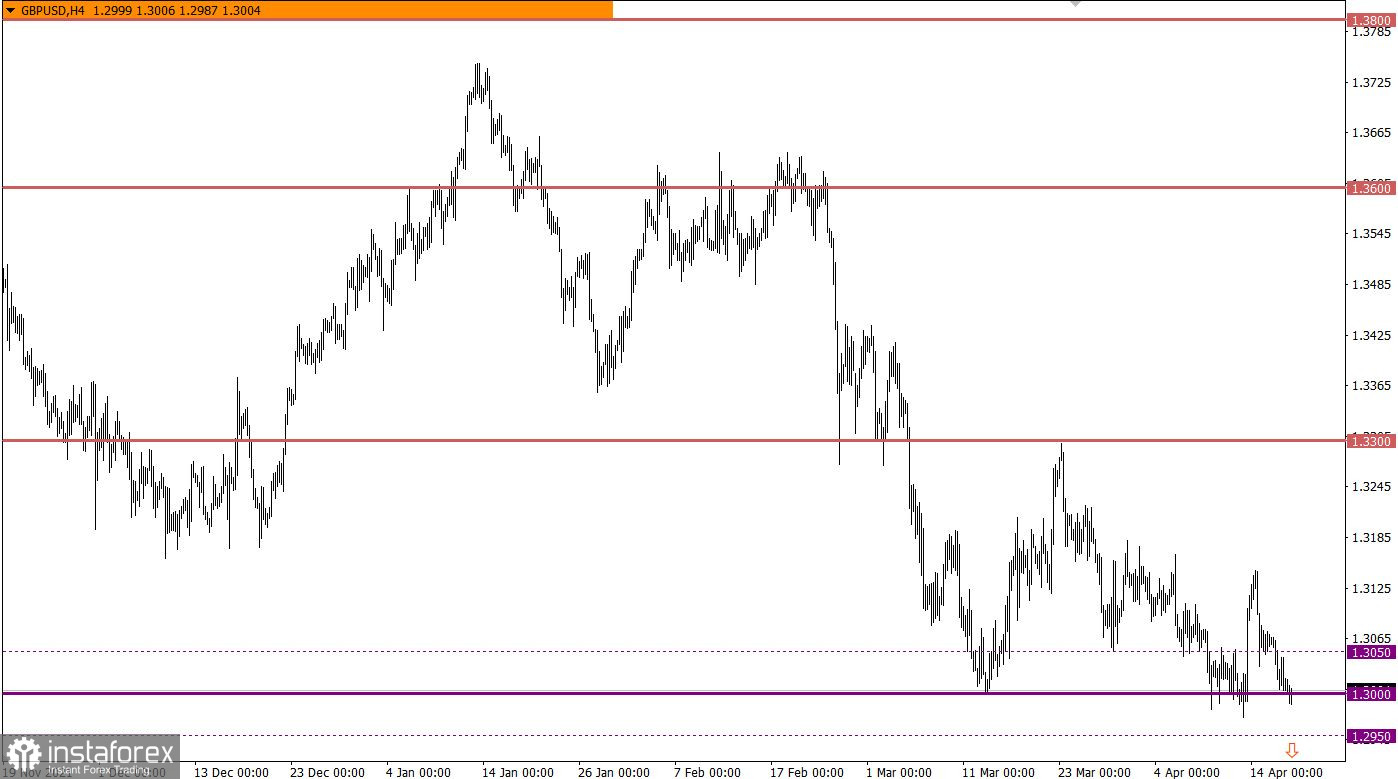
The GBPUSD currency pair completed the corrective move with a complete recovery of dollar positions. This led to the return of the price to the 1.3000 level limit, while there is confirmation of its breakdown in the four-hour period.

Today, the market activity is back to normal after the holidays. In terms of the macroeconomic calendar, we only have data for the United States construction sector, which predicts a decline in new home construction, as well as building permits. This is a negative indicator for the US economy, but it is not extremely important for the market as a whole.
Time targeting
The volume of construction of new houses - 12:30 UTC
The number of building permits issued - 12:30 UTC
The signal to sell the euro was received from the market, strengthening of short positions is possible after holding the price below the value of 1.0750. This step may well accelerate sellers towards the local lows of 2020, the price area is 1.0635/1.0660.
An alternative scenario for the development of the market considers a temporary stagnation within 1.0800. This movement does not violate the downward scenario in any way and may become a process of accumulation of trading forces.
In this situation, the main signal to sell the pound sterling will come from the market at the moment the price is kept below 1.2950. In this case, sellers will have every chance to prolong the medium-term downward trend. Otherwise, the market may stagnate within the psychological level deviations.
A candlestick chart view is graphical rectangles of white and black light, with sticks on top and bottom. When analyzing each candle in detail, you will see its characteristics of a relative period: the opening price, closing price, and maximum and minimum prices.
Horizontal levels are price coordinates, relative to which a stop or a price reversal may occur. These levels are called support and resistance in the market.
Circles and rectangles are highlighted examples where the price of the story unfolded. This color selection indicates horizontal lines that may put pressure on the quote in the future.
The up/down arrows are the reference points of the possible price direction in the future.
Dzięki analizom InstaForex zawsze będziesz na bieżące z trendami rynkowymi! Zarejestruj się w InstaForex i uzyskaj dostęp do jeszcze większej liczby bezpłatnych usług dla zyskownego handlu.


