 Anuluj
Warunki handlowe
Narzędzia


The ETH/USD crashed after reaching today's high of 1,912. It was located at 1,851 at the time of writing. You knew from my previous analysis that after the last swing higher, a retreat is natural. The rate could test and retest the near-term support levels before jumping higher again.
Technically, the altcoin is in a corrective phase in the short term. The price action developed a bullish pattern. Ethereum is down by 0.20% in the last 24 hours and by 4.04% in the last 7 days.
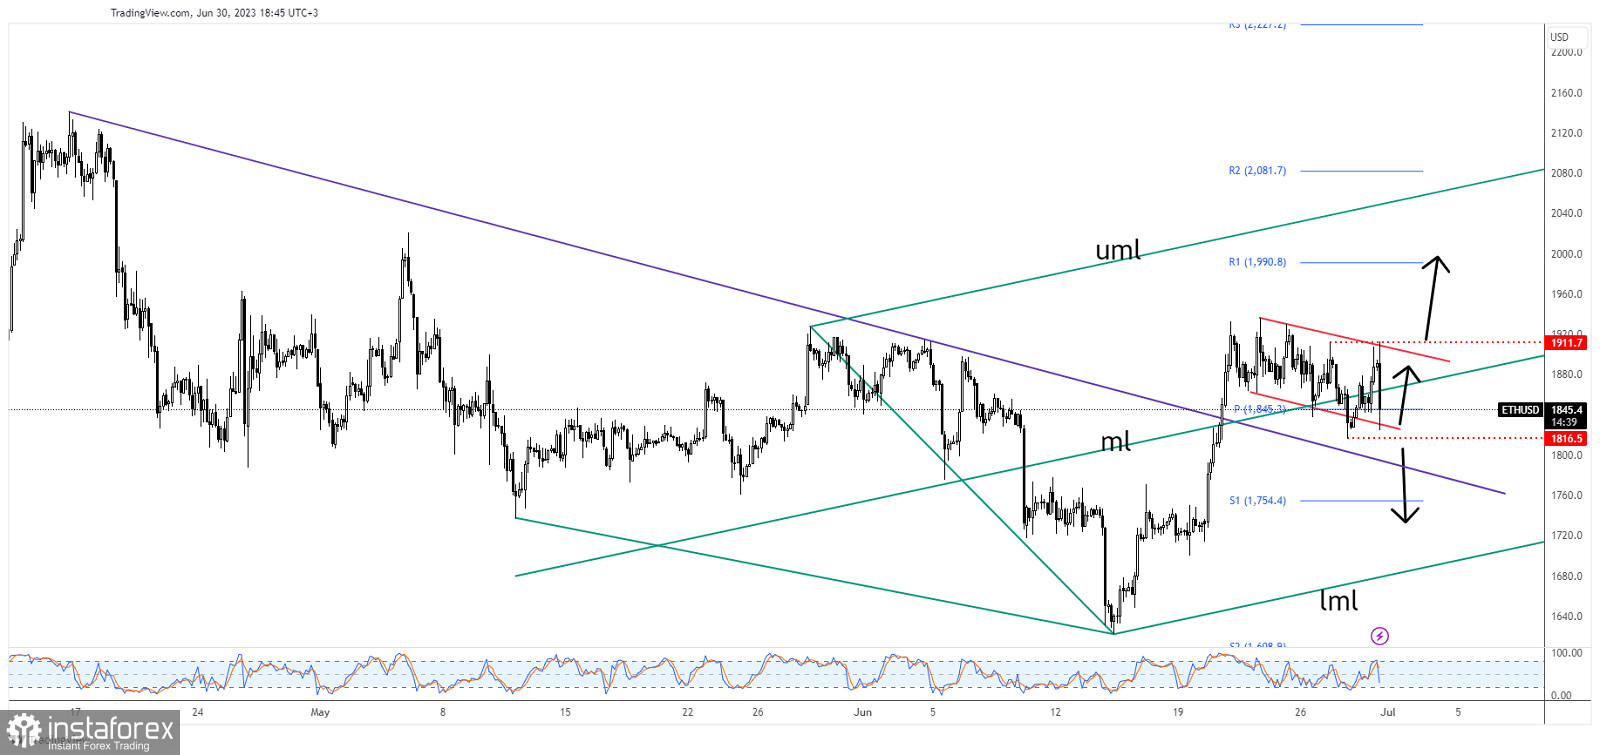
As you can see on the H4 chart, the price is still trapped within the flag pattern. It's trapped between 1,816 and 1,911 levels.
In the short term, it could continue to move sideways within this range. Escaping from this pattern should bring new opportunities.
A new higher high, jumping and closing above 1,911 should announce an upside continuation. This may represent a new long opportunity.
Dzięki analizom InstaForex zawsze będziesz na bieżące z trendami rynkowymi! Zarejestruj się w InstaForex i uzyskaj dostęp do jeszcze większej liczby bezpłatnych usług dla zyskownego handlu.


