 Anuluj
Warunki handlowe
Narzędzia


Trend analysis (Fig. 1)
EUR/USD may start moving downwards from the level of 1.0706 (closing of Friday's daily candle) towards the support level of 1.0673 (thick white line). Upon testing the level, it will resume going up to the target level of 1.0773, which is the upper fractal level (yellow dotted line).
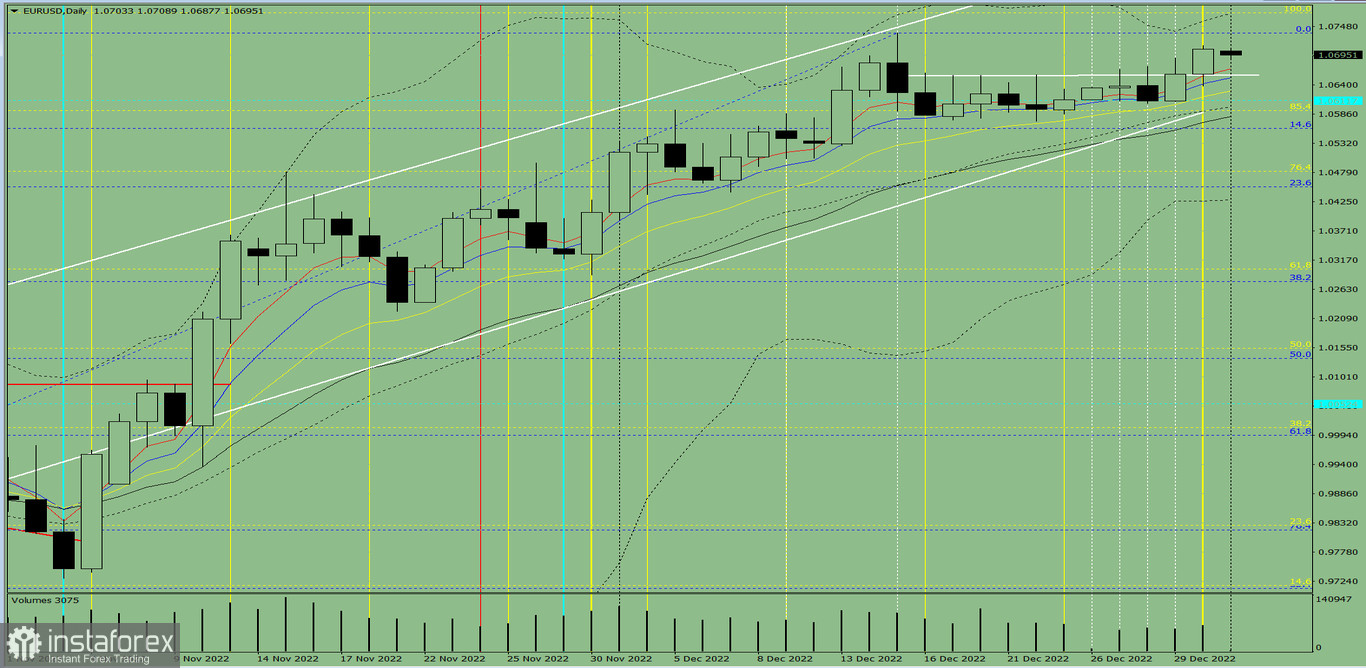
Fig. 1 (daily chart)
Comprehensive analysis:
Indicator analysis - downtrend
Fibonacci levels - downtrend
Volumes - downtrend
Candlestick analysis - uptrend
Trend analysis - uptrend
Bollinger bands - uptrend
Weekly chart - uptrend
Conclusion: EUR/USD will decline from 1.0706 (closing of Friday's daily candle) to the support level of 1.0673 (thick white line), then bounce up the upper fractal at 1.0773 (yellow dotted line).
Alternatively, the pair could climb up from 1.0706 (closing of Friday's daily candle) to the upper fractal at 1.0735, then fall down to the support level of 1.0656 (thick white line).
Dzięki analizom InstaForex zawsze będziesz na bieżące z trendami rynkowymi! Zarejestruj się w InstaForex i uzyskaj dostęp do jeszcze większej liczby bezpłatnych usług dla zyskownego handlu.


