 Anuluj
Warunki handlowe
Narzędzia


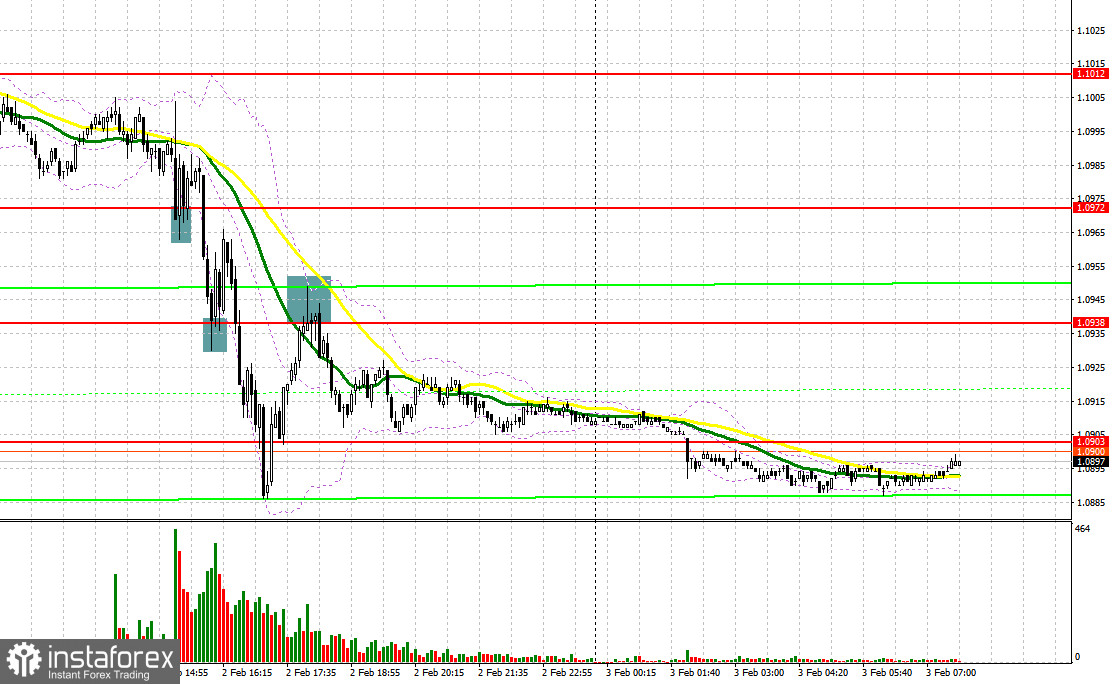
Many entry signals were generated yesterday. Let's take a look at the M5 chart to get a picture of what happened. In my previous review, I focused on 1.1003 and considered entering the market from there. Although a fall and a false breakout through the mark created a buy entry point, no increase in price followed. In the second half of the day, when the ECB announced a rate hike, the bulls protected 1.0972, which generated a buy signal. The quote advanced by about 15 pips. Pressure mounted. The same happened near 1.0938, where the bulls attempted to reverse the price again. However, after a 25-pip surge, the pair extended the fall. In the middle of the North American session, after the price failed to go above 1.0938, I received a sell signal. The quote tumbled by 35 pips.
When to open long positions on EUR/USD:
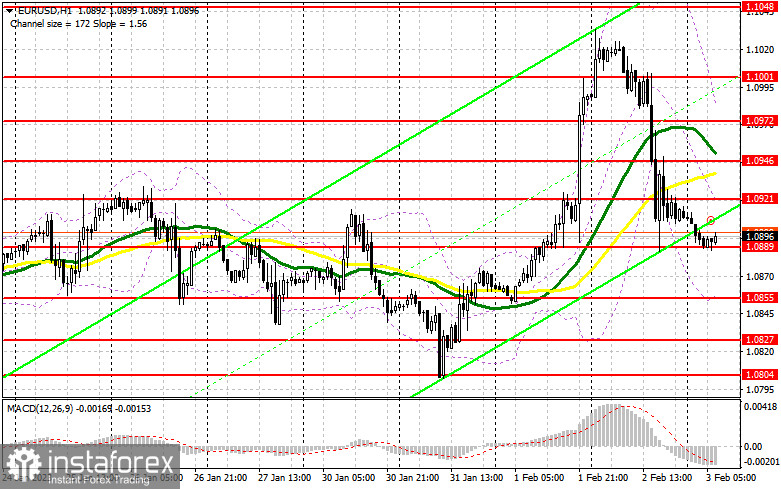
ECB President Lagarde's attempts to persuade the market that the bank would stay aggressive were all in vain. EUR/USD plunged, losing all its gains posted after the FOMC meeting. Today, the eurozone will see the release of its business activity data, which may provide substantial support for the pair. If the composite PMI goes above 50, it would indicate the expansion of the region's economy. Meanwhile, a decrease in the manufacturing PMI will have little influence on market sentiment. If the results disappoint traders, the bulls will have to protect support at 1.0889. After a false breakout through the mark, I will open long positions, targeting 1.0921. A breakout and a downside test of this level will create an additional buy entry point with the target at 1.0946, which is in line with the moving averages limiting the pair's upside potential. A breakout through this mark will trigger a row of bearish stop orders and make an additional signal. The quote may then head toward 1.0972 where I am going to lock in profits. This scenario may play out only if US labor market data comes disappointing. If EUR/USD goes down and there is no bullish activity at 1.0889 in the first half of the day, a correction may occur because if the price returns below this level, it will trigger a row of the stop orders of the bulls who entered the market yesterday. The focus will be on support at 1.0855. A false breakout will generate a buy signal. It will also become possible to open long positions at the 1.0827 low, or even lower, at 1.0804, allowing a bullish correction of 30 to 35 pips intraday.
When to open short positions on EUR/USD:
A bearish correction occurred yesterday despite all the attempts of the bulls to control the market. Today, the bears are likely to continue trading aggressively. A false breakout through resistance at 1.0921 will produce a sell signal, targeting 1.0889. A breakout and a retest of this mark will make an additional sell signal, with the target at 1.0855. The correction will grow deeper. Consolidation below this range on the back of weak data in the eurozone will push the quote to 1.0827 where I am going to lock in profits. In case of growth in EUR/USD in the European session and the absence of the bearish activity at 1.0921, the bulls will try to regain control over the market. In such a case, it will become possible to open short positions after the pair's failed attempt to settle at 1.0946. On a rebound, the instrument could be sold at the 1.0972 high, allowing a bearish correction of 30 to 35 pips intraday.
Commitments of Traders:
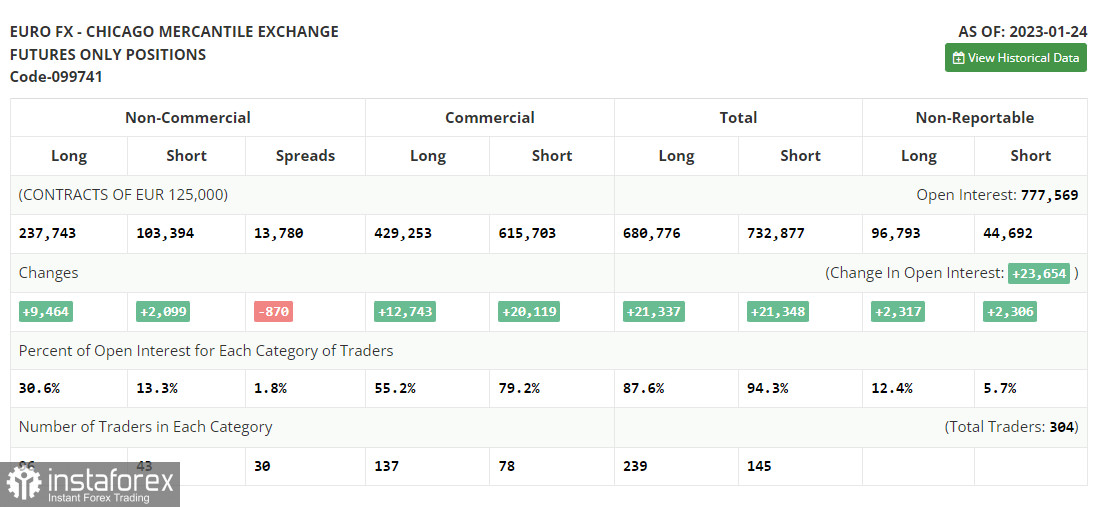
The COT report for January 24 revealed an increase in both long and short positions. Traders have opened even more long positions following the hawkish speeches of ECB officials. They bet on further monetary tightening by the ECB and anticipate the dovish Fed. The American central bank may reduce the pace of tightening for the second straight time. Weak macro data in the US, namely a drop in retail sales and a slowdown in inflation may force the regulator to take a pause in rate hikes to avoid any further harm to the economy. This week, several central banks will hold their meetings. Their outcomes will determine the future dynamic of EUR/USD. According to the COT report, long non-commercial positions increased by 9,464 to 237,743. Short non-commercial positions grew by 2,099 to 103,394. Consequently, the non-commercial net position came in at 134,349 from 126,984 a week ago. Investors seem to believe in the pair's upside potential. Anyway, they are waiting for more clues from central banks regarding interest rates. The weekly closing price rose to 1.0919 from 1.0833.
Indicator signals:
Moving averages
Trading is carried out below the 30-day and 50-day moving averages, indicating the bears' attempts to take control of the market.
Note: The period and prices of moving averages are viewed by the author on the hourly chart and differ from the general definition of classic daily moving averages on the daily chart.
Bollinger Bands
Resistance is seen at 1.0972, in line with the upper band. Support stands at 1.0855, in line with the lower band.
Indicator description:
Dzięki analizom InstaForex zawsze będziesz na bieżące z trendami rynkowymi! Zarejestruj się w InstaForex i uzyskaj dostęp do jeszcze większej liczby bezpłatnych usług dla zyskownego handlu.


