 Anuluj
Warunki handlowe
Narzędzia


Eurozone inflation for February came out at 0.8% MoM and 8.5% YoY. Food prices continue to rise aggressively, while energy costs, on the contrary, are declining.
Core inflation is also rising strongly, adding 0.8% MoM, with an annual gain of 5.6%, a record high for the eurozone.
Investors were most interested in the data on industrial production in the United States, which was much worse than expected. The previous data was revised from 0.8% to 0.5%. While the current indicators, suggesting a slowdown in growth to 0.2%, actually reflected a decline of 0.2%.
As a result, these statistics led to a sell-off in dollar positions.
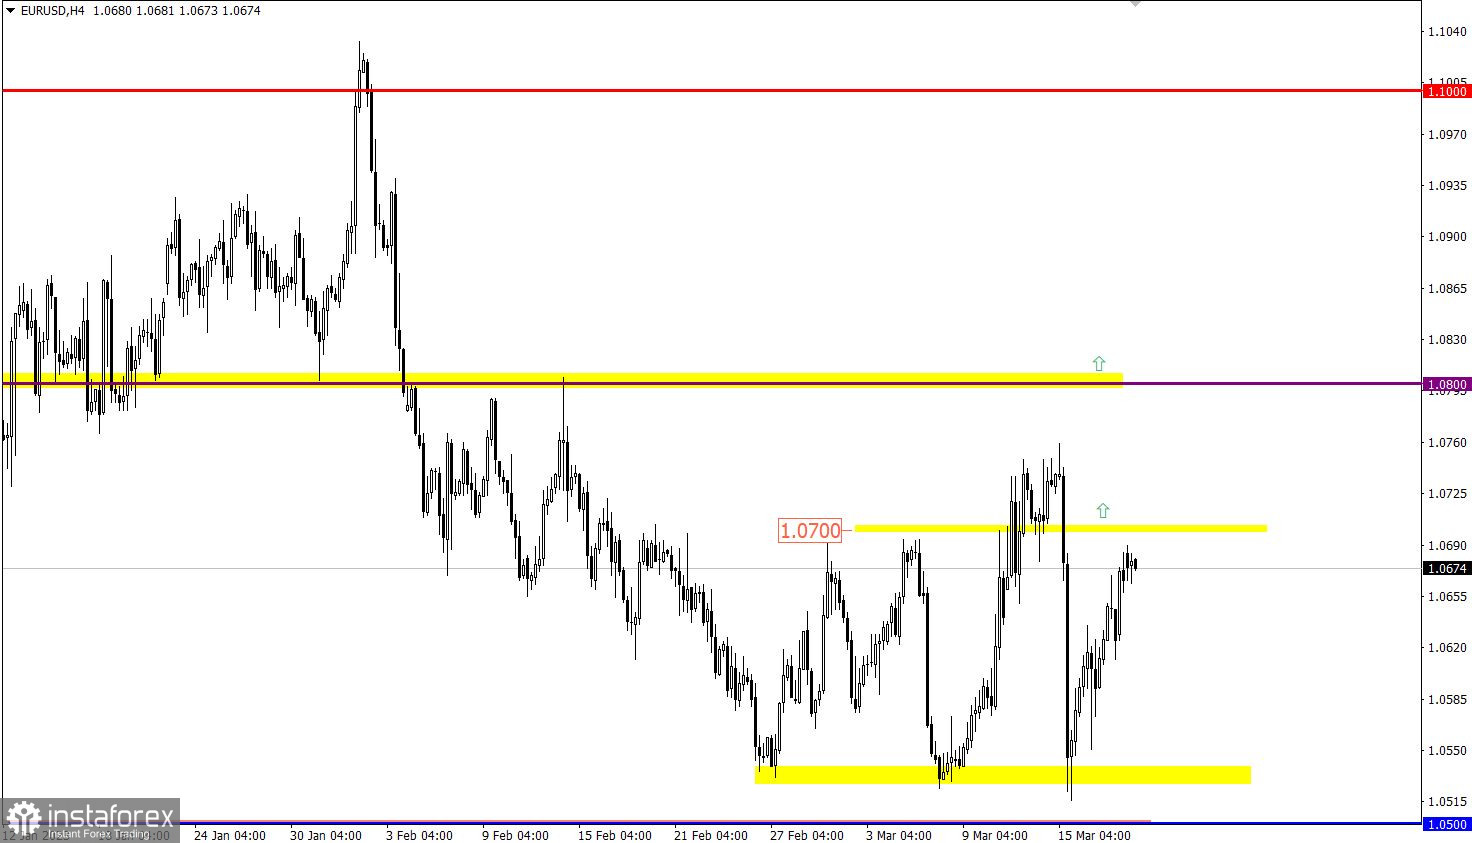
EUR/USD almost completely recovered its value after the collapse that occurred on March 15. The area of 1.0500 acts as support, near which there is a gradual increase in the volume of long positions.
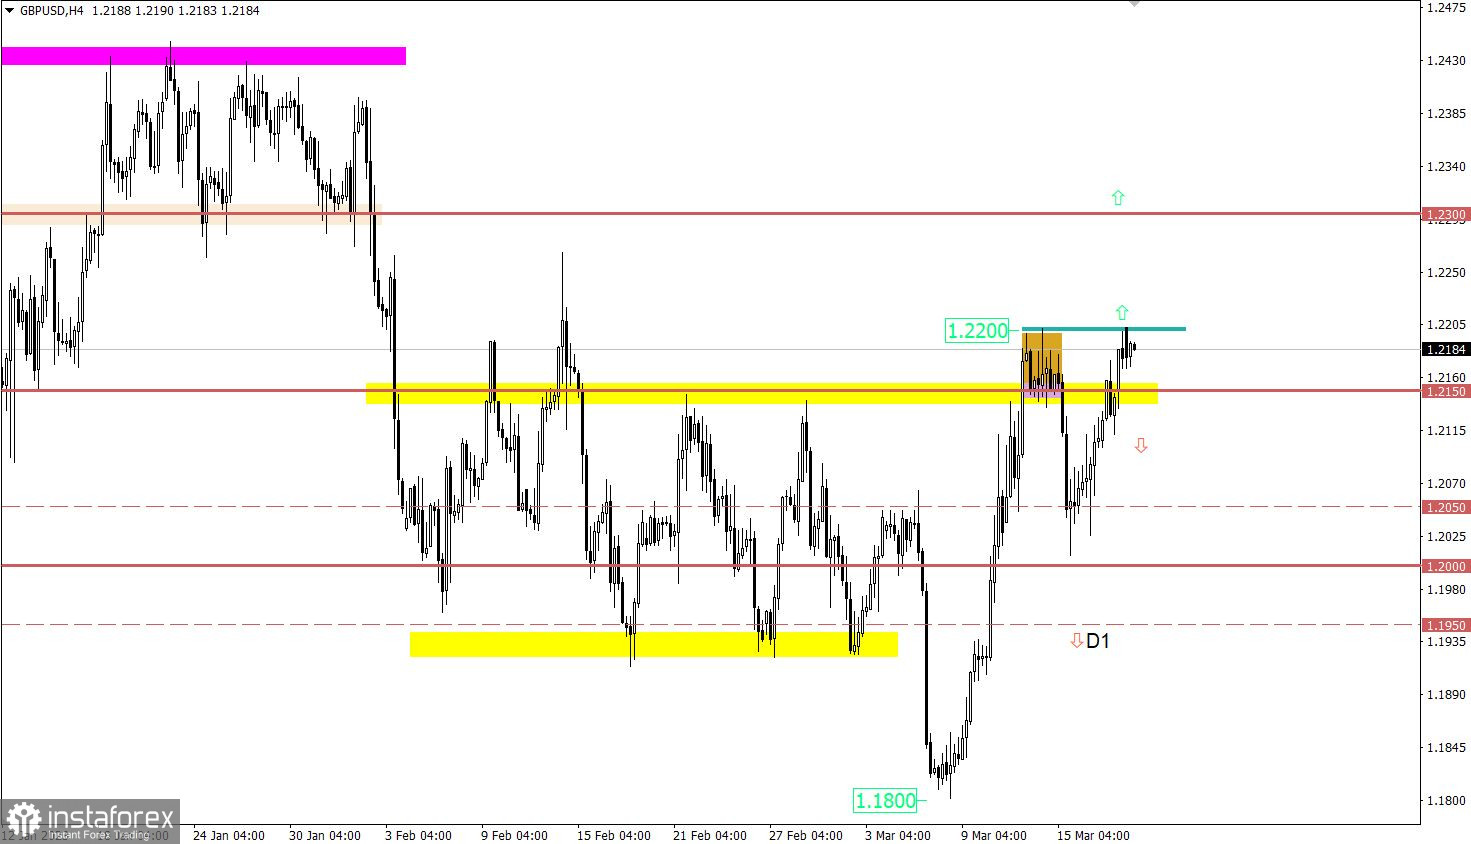
GBP/USD ended last week with a gain. The quote approached the local high of the upward cycle, which indicates the prevailing interest of traders in long positions.

The economic calendar is traditionally empty on Monday. No important reports are expected in the Eropean Union, the United Kingdom, and the Unites States.
In this regard, investors and traders plan to focus on the current information and news flow. Hot topics include inflation, interest rates and problems in the banking sector. It is worth noting that two speeches by the head of the ECB, Christine Lagarde, are scheduled today.
Time targeting:
ECB President Christine Lagarde Speech – 14:00 and 16:00 UTC
In the current situation, a stable price retention above 1.0700 in the future may contribute to the growth of the volume of long positions. This, in turn, may lead to a change in trade interests in favor of the euro. As for the alternative scenario, it is worth noting that the quote has been fluctuating within the range of 1.0550/1.0700 for a month, temporarily deviating from it. Thus, it is not necessary to exclude the possibility of continuing the movement within the existing flat.
Presumably, a stable price retention above 1.2200 will strengthen long positions in the market, which in turn will open the way to 1.2300. However, if the price returns below 1.2100, it could lead to a new move towards the 1.2000 psychological level.
The candlestick chart type is white and black graphic rectangles with lines above and below. With a detailed analysis of each individual candle, you can see its characteristics relative to a particular time frame: opening price, closing price, intraday high and low.
Horizontal levels are price coordinates, relative to which a price may stop or reverse its trajectory. In the market, these levels are called support and resistance.
Circles and rectangles are highlighted examples where the price reversed in history. This color highlighting indicates horizontal lines that may put pressure on the asset's price in the future.
The up/down arrows are landmarks of the possible price direction in the future.
Dzięki analizom InstaForex zawsze będziesz na bieżące z trendami rynkowymi! Zarejestruj się w InstaForex i uzyskaj dostęp do jeszcze większej liczby bezpłatnych usług dla zyskownego handlu.


