empty
 
 
OPUSZCZASZSTRONĘ INTERNETOWĄ
www.instaforex.eu >
firmy
INSTANT TRADING EU LTD
Otwórz konto

26.05.202308:51 Forex Analysis & Reviews: GBP/USD: trading plan for European session on May 26, 2023. Commitments of Traders. Overview of yesterday's trading. GBP rises on retail sales

Informacje te są częścią komunikacji marketingowej i są przeznaczone dla klientów detalicznych i profesjonalnych. Informacje te nie zawierają i nie powinny być interpretowane jako informacje zawierające porady inwestycyjne lub rekomendacje dotyczące inwestycji, a także oferty lub zaproszenia do udziału w dowolnej transakcji, lub strategii dotyczącej instrumentów finansowych. Wcześniejsze zyski nie stanowią gwarancji przyszłych dochodów. Instant Trading EU Ltd nie udziela żadnych gwarancji i nie ponosi żadnej odpowiedzialności za dokładność lub kompletność dostarczonych informacji, a także za jakiekolwiek straty wynikające z inwestycji opartych na analizie, prognozie lub innych informacjach dostarczonych przez pracownika Firmy, lub w jakikolwiek inny sposób. Pełne oświadczenie o wyłączeniu odpowiedzialności jest dostępne tutaj.

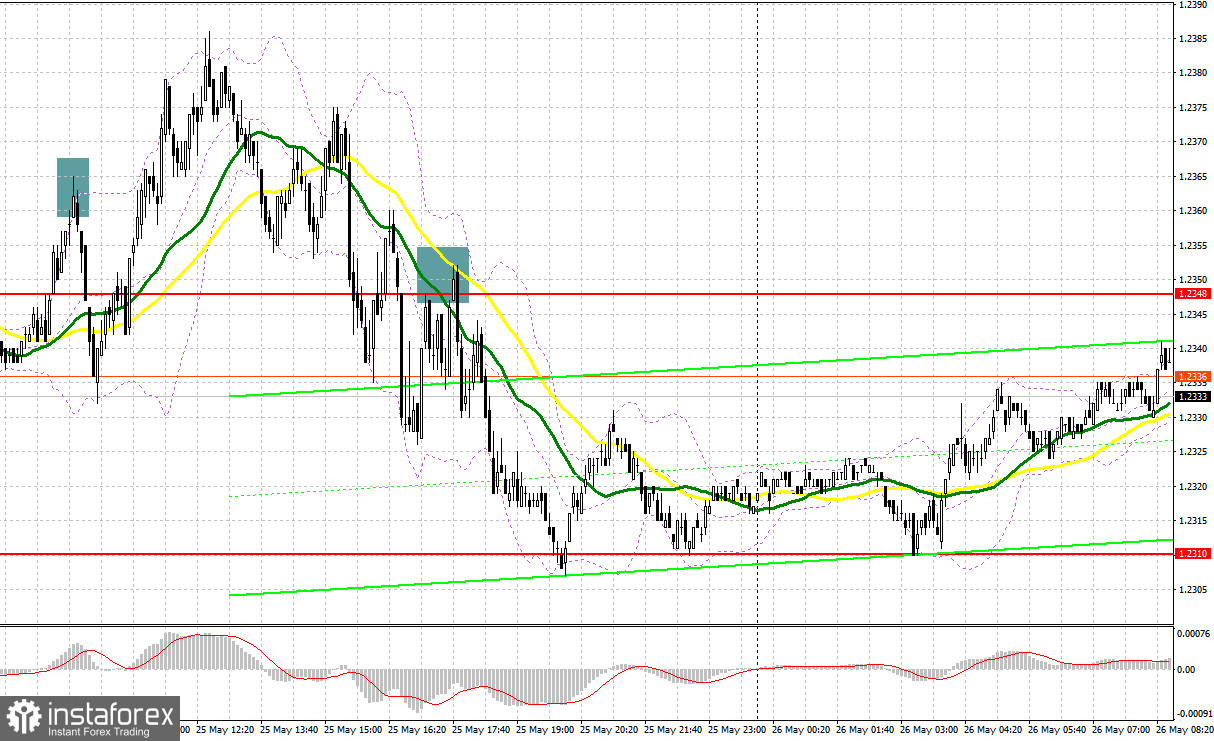
Yesterday, several entry signals were made. Let's look at the 5-minute chart to get a picture of what happened. I considered entering the market from the level of 1.2367. Growth and a false breakout generated a sell signal. The price fell by over 30 pips. In the second half of the day, a false breakout and an upside retest of 1.2348 made another sell signal. The price dropped by 35 pips more.

Exchange Rates 26.05.2023 analysis

When to open long positions on GBP/USD:

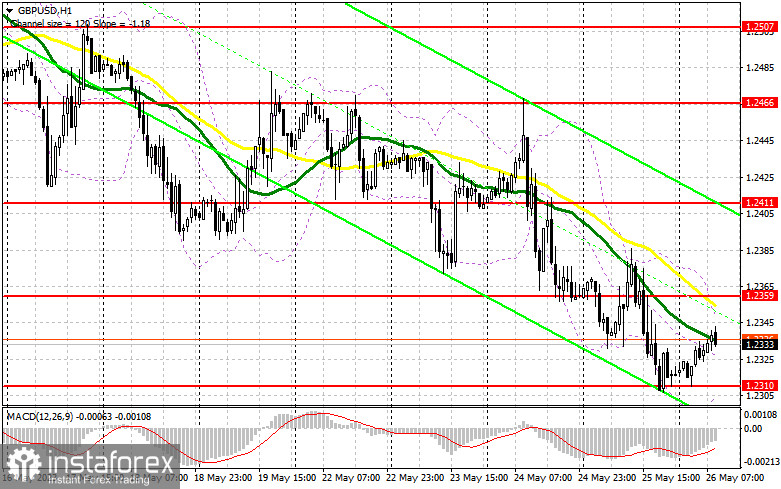
Today, the sterling has recovered against the greenback. The rise came on the back of growth in UK retail sales. Today, a bullish correction may occur. However, it would be unwise to rush to buy the asset. Only after a drop in GBP/USD and the protection of the monthly low of 1.2310, a false breakout will generate a buy signal, targeting 1.2359. This mark is in line with the bearish moving averages. A breakout and consolidation above this range will make an additional buy signal, targeting 1.2411. The most distant target is seen at 1.2466, where I will take profit. If the pair goes down to 1.2310 and there is no bullish activity, the bear market will extend. In such a case, I will buy GBP/USD at 1.2255 after a false breakout and on a bounce from 1.2192, allowing a correction of 30-35 pips intraday.

When to open short positions on GBP/USD:

Yesterday, the bears pushed the pair to yet another monthly low. However, a bullish correction will likely occur today. Moreover, UK retail sales data came upbeat. In this light, sellers may start to lock in profits. Therefore, I will open short positions after failed consolidation above 1.2359, a resistance level formed yesterday. The price will then head toward a monthly low of 1.2310. After a breakout and an upside retest, GBP/USD will face some pressure. That will generate a sell signal with the target at 1.2255. The most distant target is still at 1.2192, where I will lock in profit. If GBP/USD goes up and there is no bearish activity at 1.2359, I will sell the asset when 1.2411 resistance is tested. This level is in line with the moving averages. A false breakout will create a sell entry point. If there is no activity there either, I will sell GBP/USD on a bounce from a high of 1.2466, allowing a bearish correction of 30-35 pips intraday.

Exchange Rates 26.05.2023 analysis

The COT report (Commitments of Traders) for May 16 logged an increase in both long and short positions. In light of a quite significant correction, the pair is now trading at very attractive prices, which is reflected in the report. Demand for risk assets will likely increase once the US debt limit issue is resolved, and GBP will recover. Above all else, the Fed is planning to pause tightening, thus exerting pressure on the greenback. According to the latest COT report, short non-commercial positions rose by 2,238 to 64,795, and long non-commercial positions surged by 5,827 to 77,388. The non-commercial net position increased to 12,593 from 4,528 a week earlier. The weekly price dropped to 1.2495 from 1.2635.

Exchange Rates 26.05.2023 analysis

Indicators' signals:

Moving averages:

Trading is carried out below the 30-day and 50-day moving averages, which indicates a bearish continuation.

Note: The period and prices of moving averages are considered by the author on the H1 (1-hour) chart and differ from the general definition of the classic daily moving averages on the daily D1 chart.

Bollinger Bands

Support stands at 1.2310, in line with the lower band.

Description of indicators

  • Moving average (MA) determines the current trend by smoothing volatility and noise. Period 50. Colored yellow on the chart.
  • Moving average (MA) determines the current trend by smoothing volatility and noise. Period 30. Colored green on the chart.
  • Moving Average Convergence/Divergence (MACD). Fast EMA 12. Slow EMA 26. SMA 9.
  • Bollinger Bands. Period 20
  • Non-commercial traders are speculators such as individual traders, hedge funds, and large institutions who use the futures market for speculative purposes and meet certain requirements.
  • Long non-commercial positions are the total long position of non-commercial traders.
  • Non-commercial short positions are the total short position of non-commercial traders.
  • Total non-commercial net position is the difference between the short and long positions of non-commercial traders.
Przedstawiono Miroslaw Bawulski,
przez eksperta analitycznego
z grupy firm InsaForex © 2007-2024
Otwórz konto handlowe w InstaForex

Dzięki analizom InstaForex zawsze będziesz na bieżące z trendami rynkowymi! Zarejestruj się w InstaForex i uzyskaj dostęp do jeszcze większej liczby bezpłatnych usług dla zyskownego handlu.


Opuszczasz stronę internetową www.instaforex.eu firmy INSTANT TRADING EU LTD
Nie możesz teraz rozmawiać przez telefon?
Zadaj pytanie na czacie.

Turn "Do Not Track" off