 Anuluj
Warunki handlowe
Narzędzia


Economists had assumed that the rate of decline in the UK retail sales would slow down from 3.1% to 2.6%. However, actual data fell to 3.0%. Furthermore, previous data was revised downward to -3.9%. Despite the data falling below expectations, the British pound still slightly strengthened in value. This is because it signifies a deceleration in the rate of decline, which can be interpreted as an improvement in the situation.
During the American trading session, data on durable goods orders in the United States was published. Analysts had forecasted that the volume of these orders would decrease by 1.1%, but actual data rose by 1.1%. This statistic served as a stimulus for a slight strengthening of the dollar.
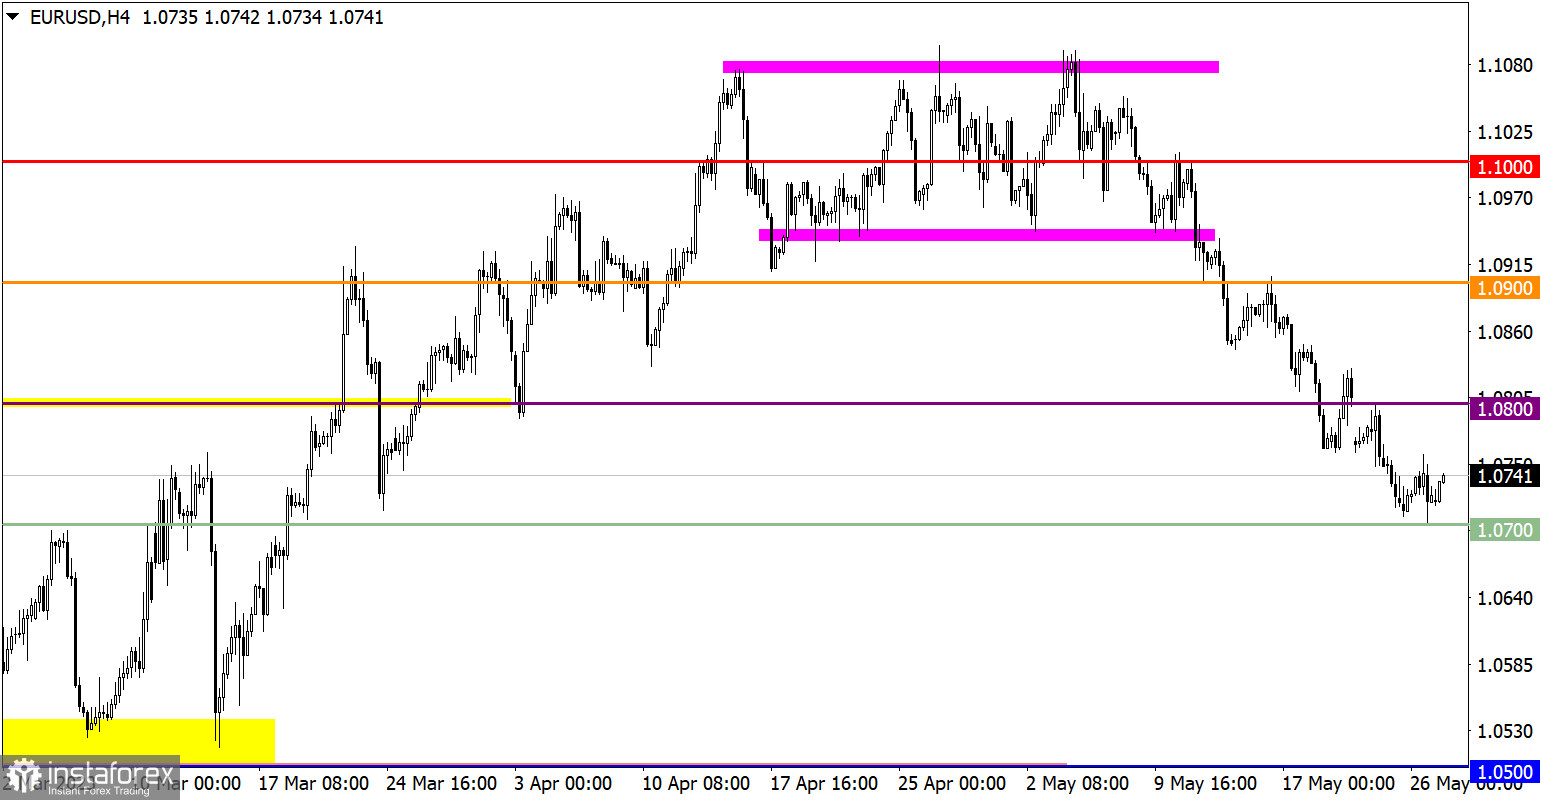
The EUR/USD exchange rate reached the level of 1.0700, which led to a reduction in the volume of short positions. As a result, the downward cycle slowed down its development and a pullback occurred, transitioning into a consolidation phase.
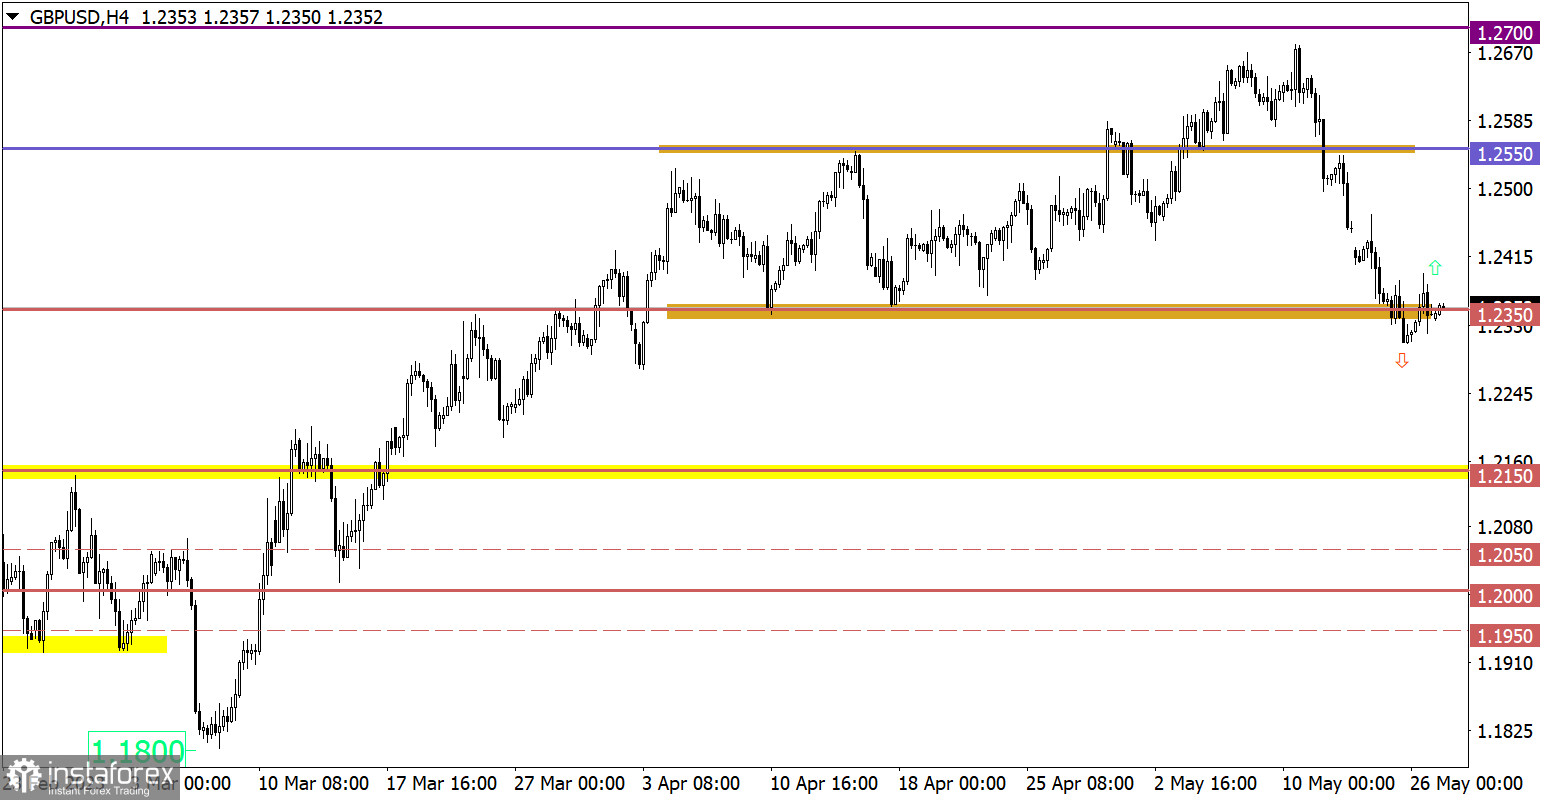
The GBP/USD exchange rate slowed down its downward cycle around the level of 1.2350. This led to a reduction in the volume of short positions and the emergence of a pullback, which subsequently transitioned into a consolidation near the support level.
There are no significant macroeconomic events scheduled in the calendar today, and it is a holiday in Europe, the United Kingdom, and the United States. As a result, a decrease in trading volumes is expected, which may have a negative impact on market volatility.
During the consolidation phase in the market, a redistribution of trading forces may occur, which could contribute to the recovery of the euro exchange rate after the recent correction. For this technical signal to be triggered, the quote needs to hold above the level of 1.0755, which may lead to further upward movement towards the level of 1.0800.
Regarding the bearish scenario, it is considered by traders as a continuation of the current corrective cycle in the market. For a technical signal of further decline to appear, the quote needs to stay below the value of 1.0700.
Considering the absence of major players in the market, it can be assumed that the current consolidation around the level of 1.2350 will persist in the near future. This is a consolidation movement that will eventually lead to the accumulation of trading forces and possible speculative price jumps.
The candlestick chart type is white and black graphic rectangles with lines above and below. With a detailed analysis of each individual candle, you can see its characteristics relative to a particular time frame: opening price, closing price, intraday high and low.
Horizontal levels are price coordinates, relative to which a price may stop or reverse its trajectory. In the market, these levels are called support and resistance.
Circles and rectangles are highlighted examples where the price reversed in history. This color highlighting indicates horizontal lines that may put pressure on the asset's price in the future.
The up/down arrows are landmarks of the possible price direction in the future.
Dzięki analizom InstaForex zawsze będziesz na bieżące z trendami rynkowymi! Zarejestruj się w InstaForex i uzyskaj dostęp do jeszcze większej liczby bezpłatnych usług dla zyskownego handlu.


