 Anuluj
Warunki handlowe
Narzędzia


Eurozone retail sales showed a month-over-month growth of 0.1% versus analysts' estimate of a more significant increase of 0.2%.
During the American trading session, the ADP report on employment levels in the United States was presented. A growth of 130,000 jobs was forecasted for November, but the actual data reflected an increase in employment of only 103,000, clearly indicating weak labor market indicators.
The ADP report is often considered by traders as a leading indicator of the U.S. Department of Labor report.

Analysis of Trading Charts from December 6
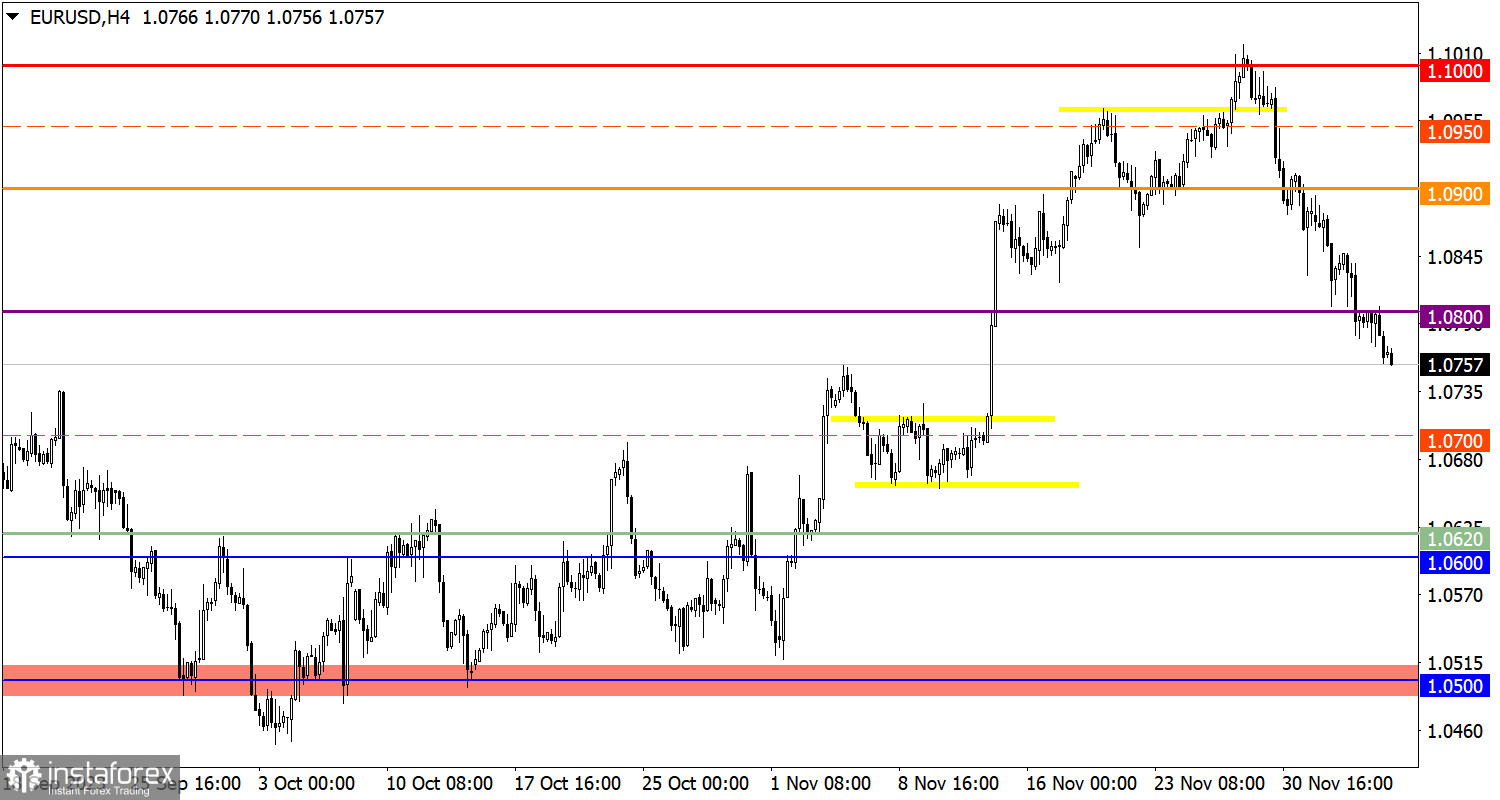
The EUR/USD currency pair not only stabilized its price below the 1.0800 level but also managed to prolong the existing corrective cycle in the market.
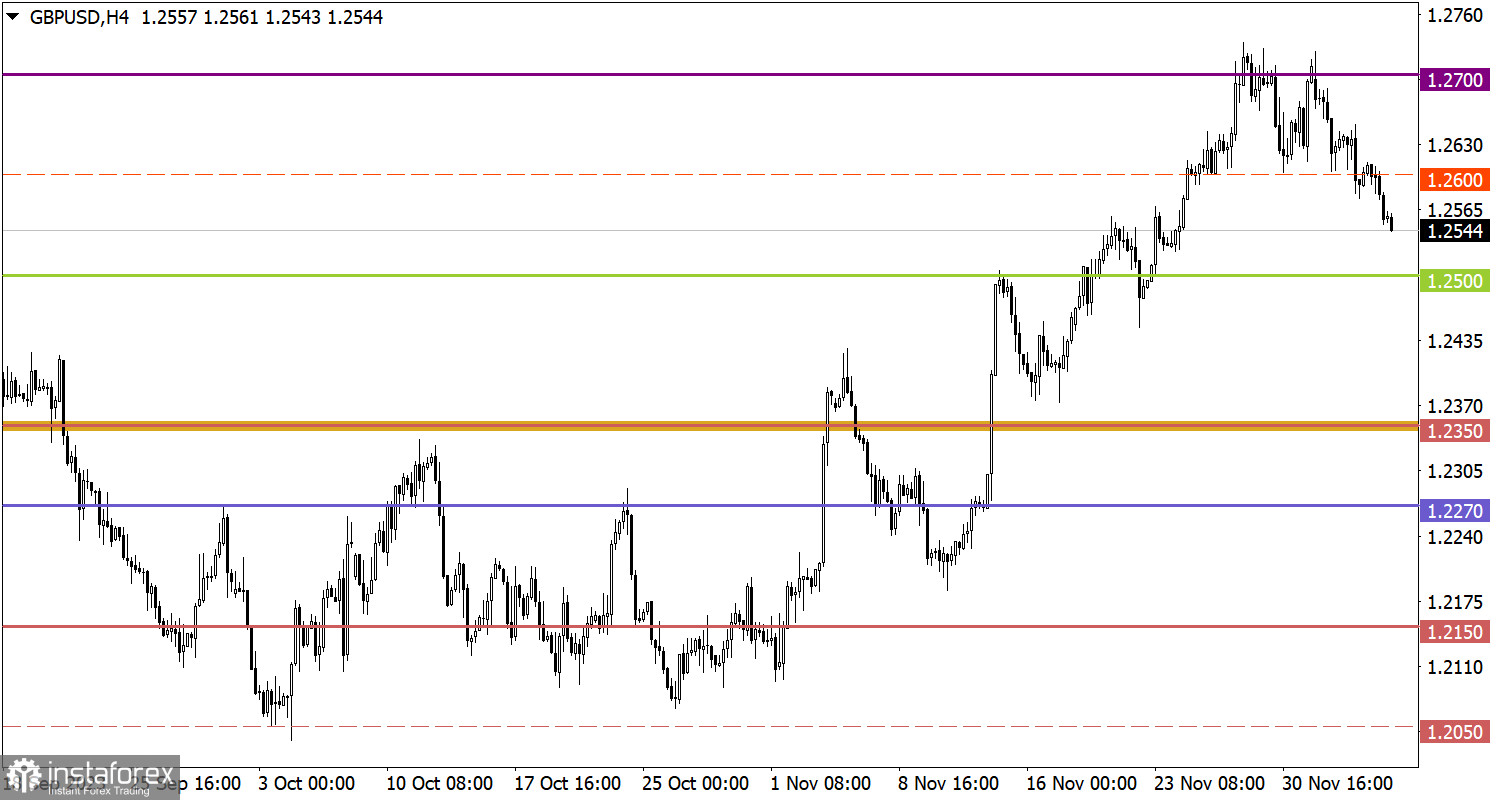
The technical picture for the GBP/USD currency pair is similar. During the corrective movement from the 1.2700 resistance level, a path of almost 200 points was covered, signaling the pound's oversold condition in the intraday period.
Economic Calendar for December 7
Today, the publication of GDP data for the EU is expected, but these indicators may generate little interest as it concerns the third estimate, which is likely to confirm the previous two. The market has already factored in this data, but if they deviate from forecasts, it could lead to speculative price fluctuations.
In the United States, weekly data on jobless claims will be published, and an overall reduction in this indicator is expected. According to statistical data, the volume of continuing claims for benefits may fall from 1.927 million to 1.910 million, while the volume of initial claims may rise from 218,000 to 222,000.
EUR/USD Trading Plan for December 7
Despite the technical signal of oversold conditions, the euro continues to decline in value, indicating sustained inertia-speculative interest from market participants. In case of further depreciation of the euro, a phased movement towards the 1.0700 level is possible. However, it is important to note that ignoring the technical oversold signal could ultimately lead to the closure of short positions on the euro, triggering an intense price rebound.
GBP/USD Trading Plan for December 7
With further inertia-driven decline, there is a possibility of movement towards the support level of 1.2500, around which a reduction in the volume of short positions may occur.
What's on the charts
The candlestick chart type is white and black graphic rectangles with lines above and below. With a detailed analysis of each individual candle, you can see its characteristics relative to a particular time frame: opening price, closing price, intraday high and low.
Horizontal levels are price coordinates, relative to which a price may stop or reverse its trajectory. In the market, these levels are called support and resistance.
Circles and rectangles are highlighted examples where the price reversed in history. This color highlighting indicates horizontal lines that may put pressure on the asset's price in the future.
The up/down arrows are landmarks of the possible price direction in the future.
Dzięki analizom InstaForex zawsze będziesz na bieżące z trendami rynkowymi! Zarejestruj się w InstaForex i uzyskaj dostęp do jeszcze większej liczby bezpłatnych usług dla zyskownego handlu.


