 Anuluj
Warunki handlowe
Narzędzia


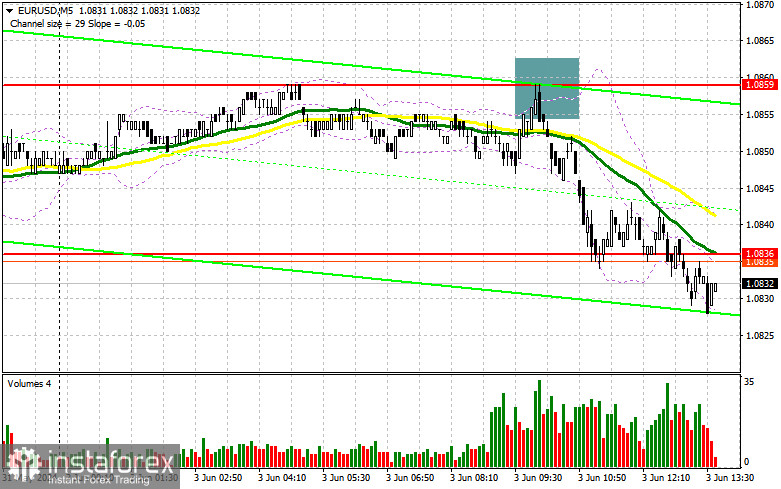
In my morning forecast, I paid attention to the 1.0859 level and planned to decide to enter the market from it. Let's look at the 5-minute chart and figure out what happened there. The growth and formation of a false breakdown there led to a signal to sell the euro, which resulted in a 30-point drop in the pair. In the afternoon, the technical picture still needed to be revised.
To open long positions on EURUSD, you need:
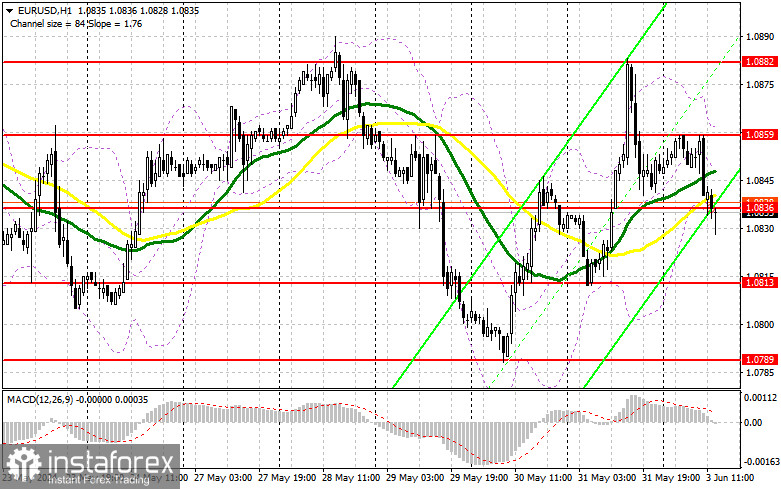
Disappointing data on activity in the manufacturing sector of the eurozone countries put pressure on the euro in the first half of the day, as I warned in my morning forecast. The focus will shift to similar reports, but only for the United States. Figures on the ISM manufacturing index are planned, which may also be very disappointing, which will return demand for risky assets and put pressure on the dollar, as well as less significant data on changes in spending in the construction sector and total car sales in the United States. In case of further decline of the pair, before buying, we would like to see the presence of bulls in the area of the new support of 1.0836, which is now being tested for strength. I'm going to open long positions there only after the formation of a false breakdown, which will be a suitable option for entering the market, counting on a further correction after weak US data and a resistance test of 1.0859, above which it was not possible to get out in the first half of the day. A breakout and a top-down update of this range will strengthen the pair with a chance of a return to the uptrend and a breakthrough to 1.0882. The farthest target will be a maximum of 1.0918, where I will record profits. With the option of a decrease in EUR/USD and a lack of activity around 1.0836 in the afternoon, the pressure on the market will return, leading to a larger drop in the pair to the area of 1.0813. I will also enter there only after the formation of a false breakdown. I plan to open long positions immediately for a rebound from 1.0789 with the aim of an upward correction of 30-35 points within the day.
To open short positions on EURUSD, you need:
Sellers have a chance to bring the market back under control, but this requires good statistics for the United States, indicating a return to growth in production activity in May this year. Before selling, it is best to wait for a false breakdown in the area of the morning resistance of 1.0859, similar to what I discussed above. This will give an entry point to new short positions with the prospect of a decline in the euro and an update of support at 1.0836. A breakout and consolidation below this range and a reverse bottom-up test will give another selling point, with the pair moving to the low of 1.0813, where I expect to see a more active manifestation of buyers. The farthest target will be a minimum of 1.0789, where I will record profits. In the event of an upward movement of EUR/USD in the afternoon and the absence of bears in the area of 1.0859, buyers will regain their advantage. In this case, I will postpone sales until the test of the next resistance of 1.0882. I will also sell there, but only after an unsuccessful consolidation. I plan to open short positions immediately for a rebound from 1.0918 with the aim of a downward correction of 30-35 points.
Indicator signals:
Moving averages
Trading is conducted around the 30 and 50-day moving averages, which indicates market uncertainty.
Note: The author considers the period and prices of the moving averages on the hourly chart H1, which differs from the general definition of the classic daily moving averages on the daily chart D1.
Bollinger Bands
In case of a decline, the lower limit of the indicator in the area of 1.0836 will act as support.
Description of the indicators
• Moving average (moving average determines the current trend by smoothing volatility and noise). Period 50. It is marked in yellow on the chart.
• Moving average (moving average determines the current trend by smoothing volatility and noise). Period 30. It is marked in green on the chart.
• MACD indicator (Moving Average Convergence/Divergence — convergence/divergence of moving averages) Fast EMA period 12. Slow EMA period 26. SMA period 9
• Bollinger Bands. Period 20
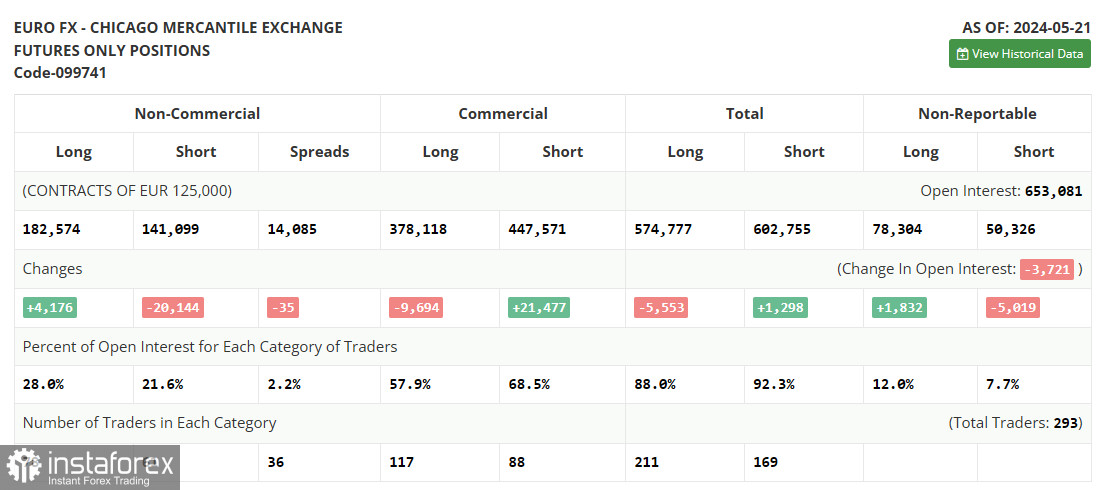
• Non-profit speculative traders, such as individual traders, hedge funds, and large institutions that use the futures market for speculative purposes and meet specific requirements.
• Long non-commercial positions represent the total long open position of non-commercial traders.
• Short non-commercial positions represent the total short open position of non-commercial traders.
• The total non-commercial net position is the difference between non-commercial traders' short and long positions.
Dzięki analizom InstaForex zawsze będziesz na bieżące z trendami rynkowymi! Zarejestruj się w InstaForex i uzyskaj dostęp do jeszcze większej liczby bezpłatnych usług dla zyskownego handlu.


