 Anuluj
Warunki handlowe
Narzędzia


On the hourly chart, GBP/USD rebounded from the 1.2488–1.2508 resistance zone, turning in favor of the U.S. dollar and declining toward the 1.2363–1.2370 support zone. The pair's rebound from this support suggests a potential reversal in favor of the pound, with a move back toward the 1.2488–1.2508 range. However, a break below 1.2363–1.2370 would increase the likelihood of further decline toward the Fibonacci 261.8% level at 1.2303.
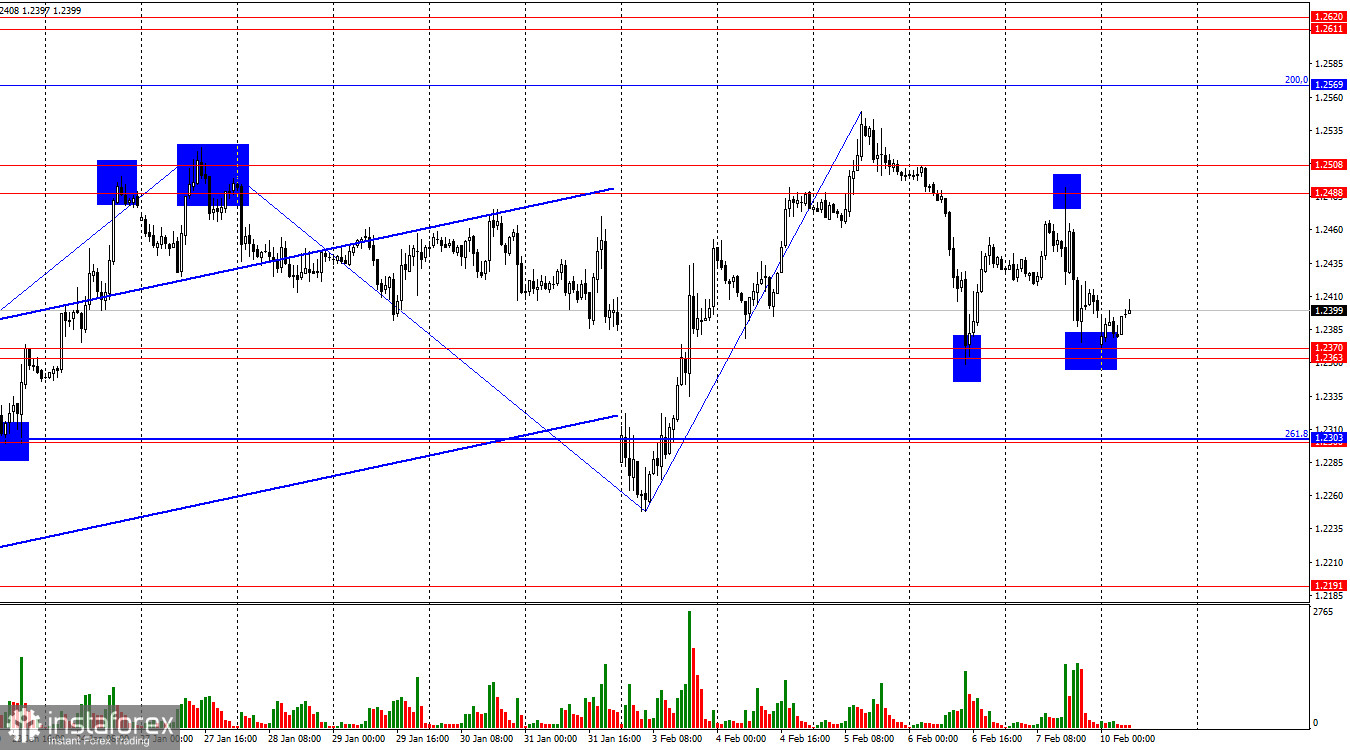
The wave analysis is relatively clear. The latest downward wave failed to break the previous low. The latest upward wave surpassed the previous high. This suggests a continuation of the bullish trend. However, wave sizes and formations have varied significantly, making it uncertain whether this trend will persist for weeks.
Last Friday, the U.S. released four major economic reports, three of which were strong—providing bearish pressure on GBP/USD. Despite these fundamentals, bears failed to break below 1.2363–1.2370, suggesting this zone remains a strong support level. If weak UK data and strong U.S. reports emerge this week, bears may finally push below support, triggering a bearish trend shift. However, Monday is devoid of economic reports from both the UK and the U.S.
On Monday, Donald Trump implemented a new 25% tariff on imported steel and aluminum. This initially pressured GBP and EUR at market open, but both currencies recovered shortly after. So far, Trump's tariffs have consistently supported the U.S. dollar, but the market will soon shift focus to key economic reports later this week.
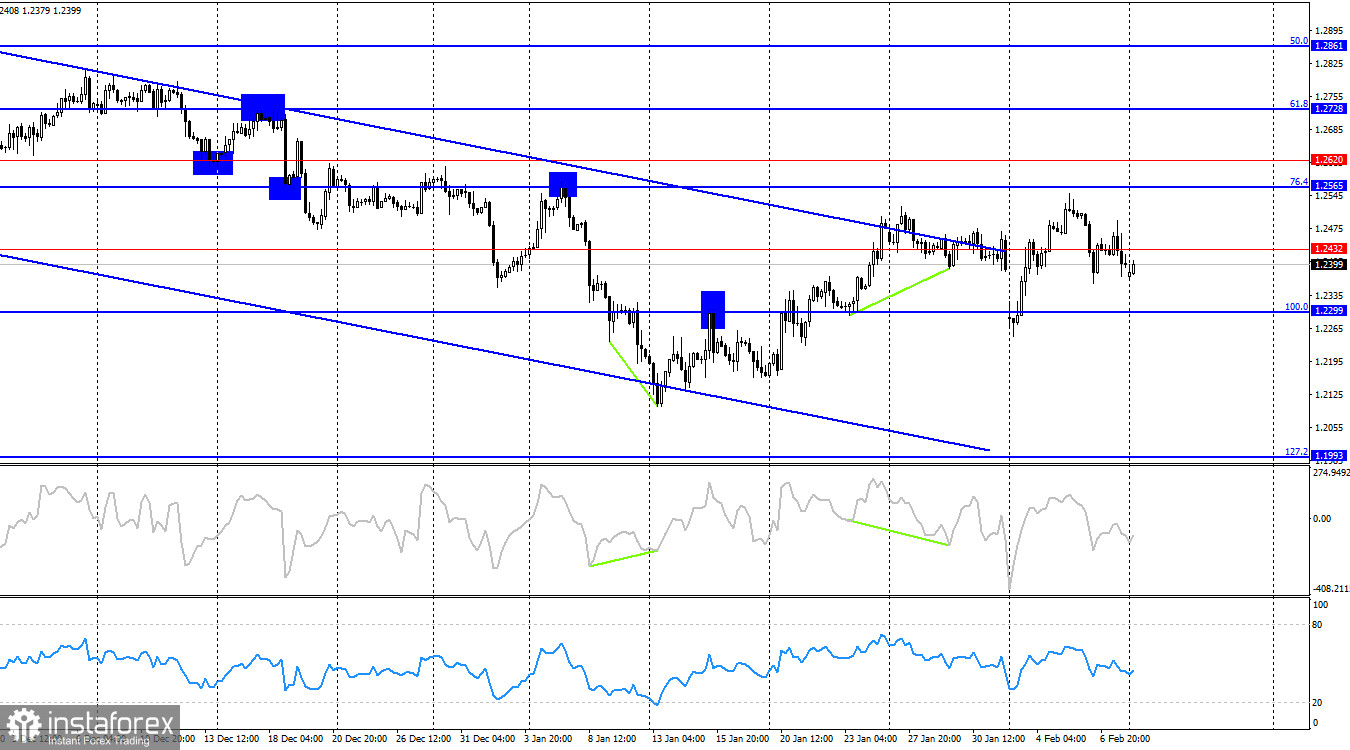
On the 4-hour chart, the GBP/USD reversed downward and consolidated below 1.2432, signaling continued bearish momentum toward the 100% Fibonacci level at 1.2299. A rebound above 1.2432 would signal a return to bullish pressure and an exit from the downward trend channel. Currently, no divergence signals are present on key technical indicators.
Commitments of Traders (COT) Report Analysis
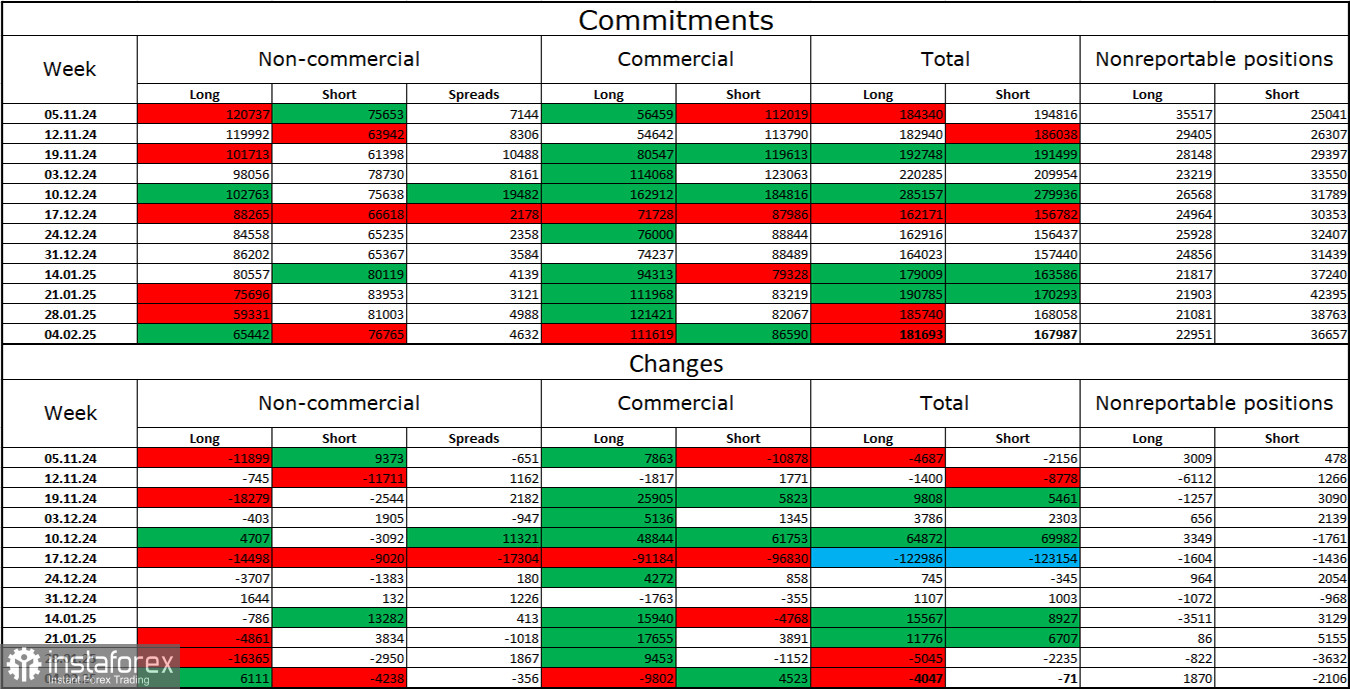
The mood of the "Non-commercial" category of traders has become less "bearish" over the last reporting week. Long positions increased by 6,111, while short positions decreased by 4,238. Net positioning remains bearish: 65,000 longs vs. 76,000 shorts.
GBP remains fundamentally weak, and COT data suggests bearish momentum is gradually strengthening. Over the past three months, long positions declined from 120,000 to 65,000, while short positions rose from 75,000 to 76,000. Professional traders continue to unwind longs or increase shorts, as most GBP bullish factors have already played out. Technicals suggest short-term growth, but corrections are likely before any sustained moves.
Economic Calendar for the U.S. & UK
On Monday, no key economic reports scheduled for either the U.S. or the UK. Minimal fundamental influence on market sentiment today.
GBP/USD Trading Recommendations
Selling GBP/USD was possible on a rebound from the 1.2488–1.2508 resistance zone with a target of 1.2363–1.2370 (this target was successfully met). A rebound from 1.2363–1.2370 allows traders to open long positions, targeting 1.2488–1.2508.
Fibonacci Levels for GBP/USD
The Fibonacci level grids are based on 1.3000–1.3432 on the hourly chart and 1.2299–1.3432 on the 4-hour chart.
Dzięki analizom InstaForex zawsze będziesz na bieżące z trendami rynkowymi! Zarejestruj się w InstaForex i uzyskaj dostęp do jeszcze większej liczby bezpłatnych usług dla zyskownego handlu.


