Informacje te są częścią komunikacji marketingowej i są przeznaczone dla klientów detalicznych i profesjonalnych. Informacje te nie zawierają i nie powinny być interpretowane jako informacje zawierające porady inwestycyjne lub rekomendacje dotyczące inwestycji, a także oferty lub zaproszenia do udziału w dowolnej transakcji, lub strategii dotyczącej instrumentów finansowych. Wcześniejsze zyski nie stanowią gwarancji przyszłych dochodów. Instant Trading EU Ltd nie udziela żadnych gwarancji i nie ponosi żadnej odpowiedzialności za dokładność lub kompletność dostarczonych informacji, a także za jakiekolwiek straty wynikające z inwestycji opartych na analizie, prognozie lub innych informacjach dostarczonych przez pracownika Firmy, lub w jakikolwiek inny sposób. Pełne oświadczenie o wyłączeniu odpowiedzialności jest dostępne tutaj.
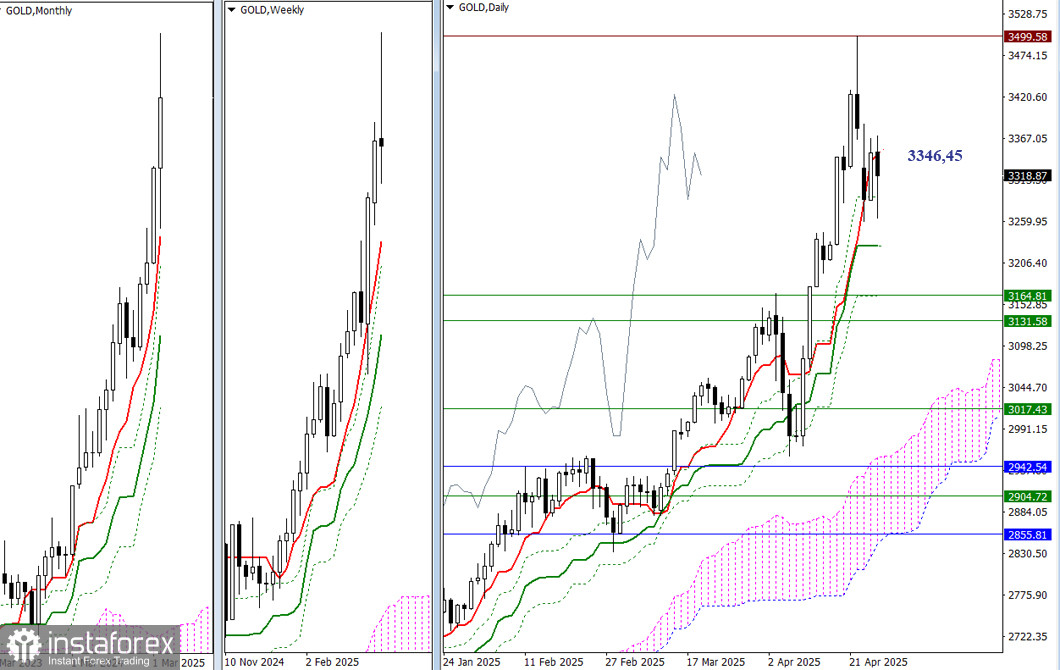
Last week, the bulls updated historical highs and formed a new maximum extremum at 3499.58. Afterward, gold entered a downward correction towards the support of the daily short-term trend at 3346.45. The market has taken a pause. If bearish sentiment receives a new impulse for development, the next target will be the daily medium-term trend at 3227.79, and then the corrective decline may extend toward the support of the weekly short-term trend at 3164.81. Eliminating the daily golden cross at 3163.64 and consolidating below the weekly levels at 3164.81–3131.58 would open up new bearish prospects.
![Exchange Rates 28.04.2025 analysis]()
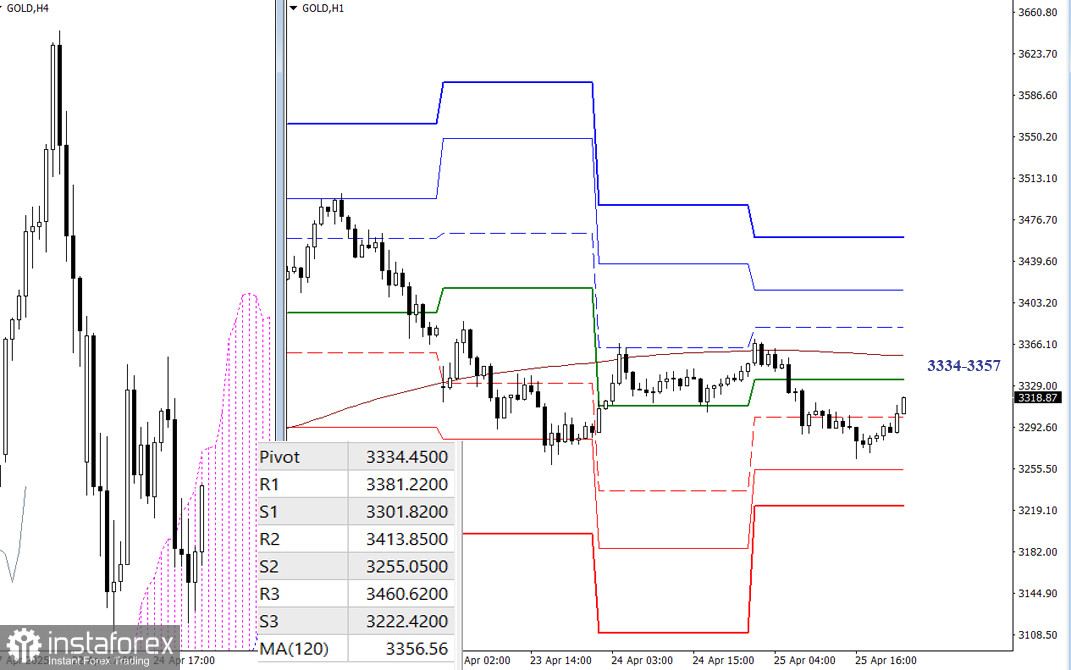
On the lower timeframes, the main advantage remains with the bears. The market is operating below the key levels, currently at 3334.45 (the daily central Pivot level) and 3356.56 (the weekly long-term trend). Consolidation above the trend line and its reversal could shift the current balance of forces in favor of further bullish recovery. Resistance levels will be important for the bulls if the market starts developing directed movements, and support levels will be important for the bears according to the classic pivot points. Pivot levels are updated daily, and new actual data will appear at the opening of trading.
***
Technical Analysis Components:
- Higher Timeframes: Ichimoku Kinko Hyo (9.26.52) and Fibonacci Kijun levels
- H1: Classic Pivot Points and 120-period Moving Average (weekly long-term trend)
Otwórz konto handlowe w InstaForex
Dzięki analizom InstaForex zawsze będziesz na bieżące z trendami rynkowymi! Zarejestruj się w InstaForex i uzyskaj dostęp do jeszcze większej liczby bezpłatnych usług dla zyskownego handlu.
 Anuluj