 Anuluj
Warunki handlowe
Narzędzia



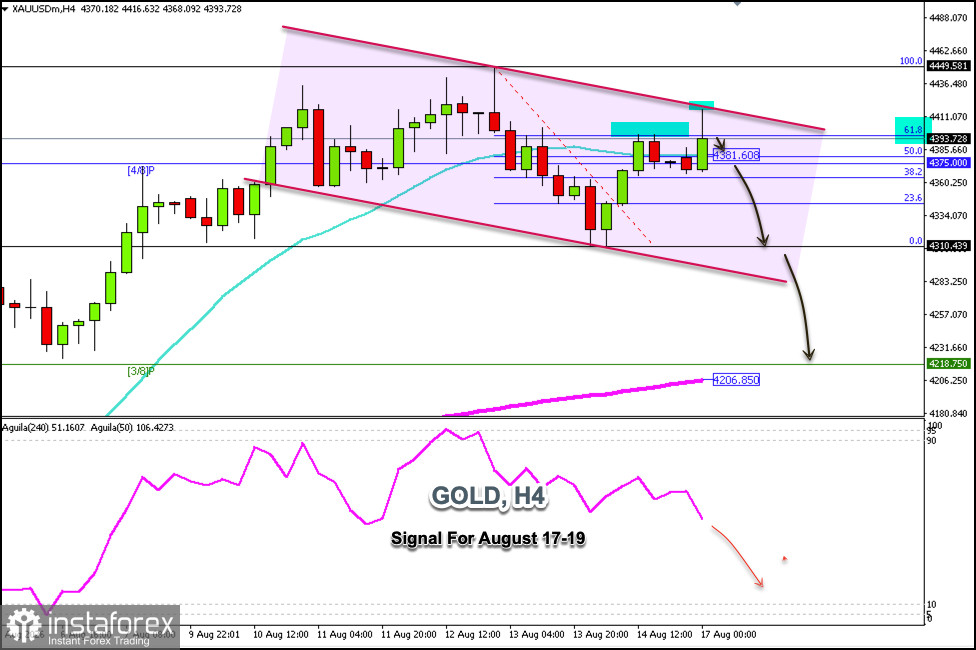
Gold is trading around $4,393, above the 21-day SMA, rebounding from the low of $4,399 and reaching the 61.8% Fibonacci level—a level that was also reached last Friday, after which we saw a technical correction.
Once again, gold is reaching the 61.8% Fibonacci level, and if the price consolidates below $4,395 in the coming hours, this could be seen as a further downtrend. If this scenario plays out, we could expect the instrument to reach $4,300 in the coming days. Gold might even retreat toward the 200 EMA, located around $4,206.
Conversely, if the price consolidates above $4,400 in the coming hours, the outlook could remain positive, and we could expect it to reach the August 12 high around $4,449 or even hit the strong psychological resistance level of $4,500.
Given that the Eagle indicator is showing a negative signal, we believe that gold will continue to fall in the coming days, so we must pay close attention to the strong resistance levels at $4,420, $4,449, or even $4,485. If it reaches any of these levels, it could be seen as a signal to open short positions in anticipation of a drop to the low of $4,310 and, ultimately, the 200 EMA around $4,206.
Gold may struggle to continue rising, as it is currently overbought. If it reaches $4,450, we should keep an eye on this price, as it shows signs of exhaustion and could be considered a sell signal.
Dzięki analizom InstaForex zawsze będziesz na bieżące z trendami rynkowymi! Zarejestruj się w InstaForex i uzyskaj dostęp do jeszcze większej liczby bezpłatnych usług dla zyskownego handlu.


