 Anuluj

Warunki handlowe
Narzędzia


Technical analysis of the ETH/USD daily chart reveals a notable positive shift and price behavior characterized by structural bullish momentum. This follows a period of volatility and base-building near lower support levels; the price is now moving within defined channels, charting a clear path toward testing higher resistance levels in the near-to-medium term.
Price Structure and Bullish Channels
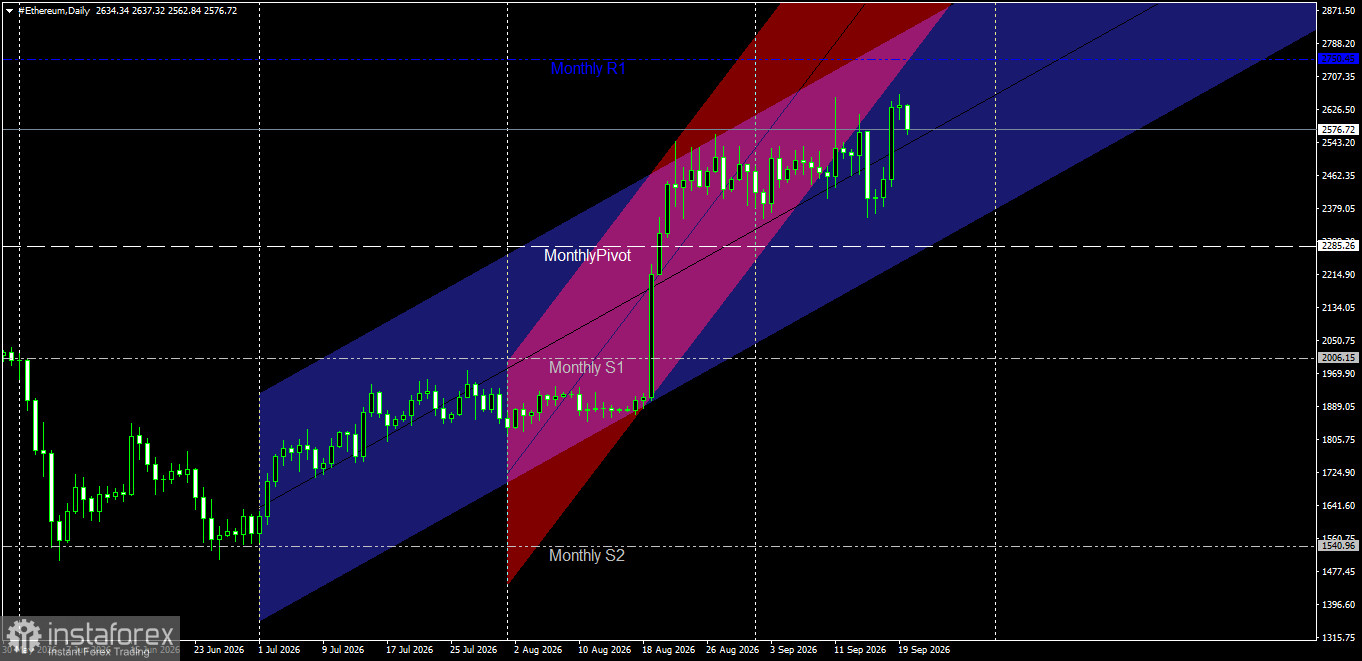
Examination of the chart clearly shows the price adopting a steady upward trend within a primary ascending channel (dark blue zone) that has been in place since early July. Within this main channel, price action saw a marked acceleration in momentum during mid-August, leading to the formation of a steeper secondary ascending channel (purple/red zone).
This acceleration marks a transition from a slow, gradual rise to a powerful surge, highlighted by an exceptionally long bullish candle that broke through multiple key levels in a single session. Maintaining a position above the main channel indicates that buyers are in full control of the overall trend, while recent fluctuations near the channel's upper boundary reflect an ongoing effort to consolidate this momentum and prepare for a new breakout. Support, Resistance, and Pivot Levels
The analysis relies primarily on the monthly pivot levels shown on the chart, which provide a precise roadmap for identifying targets and support levels:
First Resistance Level (Monthly R1): Situated at approximately $2,750.45 (the upper dashed blue line). This level represents the primary near-term target and the most significant resistance currently preventing a rapid surge toward higher levels.
Current Price: The price is currently trading around the $2,576.72 mark, having moved within a range of $2,543.20 to $2,637.32 during recent sessions.
Monthly Pivot Point: Located at $2,285.26. This area serves as the primary, pivotal line of defense; as long as the price trades above it, a positive market outlook prevails.
Key Support Levels (Monthly S1 & S2): Located at $2,006.15 (S1) and $1,540.96 (S2). The first level (S1) represents a robust support base in the event of any future deep correction.
Price Action and Recent Volatility Analysis
Following the strong surge in mid-August—which clearly pushed the price above the $2,285.26 pivot point—Ethereum entered a re-accumulation and price consolidation phase, confined between a lower limit of $2,462.35 and an upper limit of $2,637.32. During the final days of September, the price made several attempts to break through the nearby resistance level. We observe upper and lower shadows on recent candlesticks, indicating a tug-of-war between buying pressure pushing upward and selling pressure—driven by profit-taking—near the upper boundary of the rising channel. Nevertheless, the price's ability to maintain daily closes above the midpoint of the rising channel gives a clear advantage to the bullish trend.
Price Movement Outlook and Potential Scenarios
Based on the technical data and the geometric pattern shown on the chart, two main scenarios for future price movement can be outlined:
1. The Bullish Scenario (Most Likely):
This scenario requires the price to successfully break through the nearby resistance at $2,637.32, accompanied by a confirmed daily close above it. In this case, the price would move directly to test the first monthly resistance level (Monthly R1) at $2,750.45. Successfully breaching this level—which lies near the upper boundary of the sub-channel—would pave the way for further gains, targeting the $2,871.50 level and beyond in the medium term.
2. The Corrective Scenario (Alternative):
Should the price fail to break the nearby peak and instead enter a profit-taking phase, it is expected to retest nearby support zones at $2,462.35 or $2,379.05. As long as the price remains above the Monthly Pivot level ($2,285.26), such a pullback would be considered a healthy correction to rebuild momentum before resuming the upward trend. Only if the 2285.26 level is broken and the price closes below it will the current bullish scenario be invalidated, with the price heading toward the first monthly support level at $2006.15.
Technical analysis of the 4-hour (H4) chart for Ethereum against the US Dollar (ETH/USD) reveals price action characterized by momentum and notable volatility within an overall bullish trend. This fluctuation follows a strong impulsive wave during which the price broke through intermediate pivotal levels and targeted the upper boundaries of the ascending price channel.
Price Structure and Trend Channels
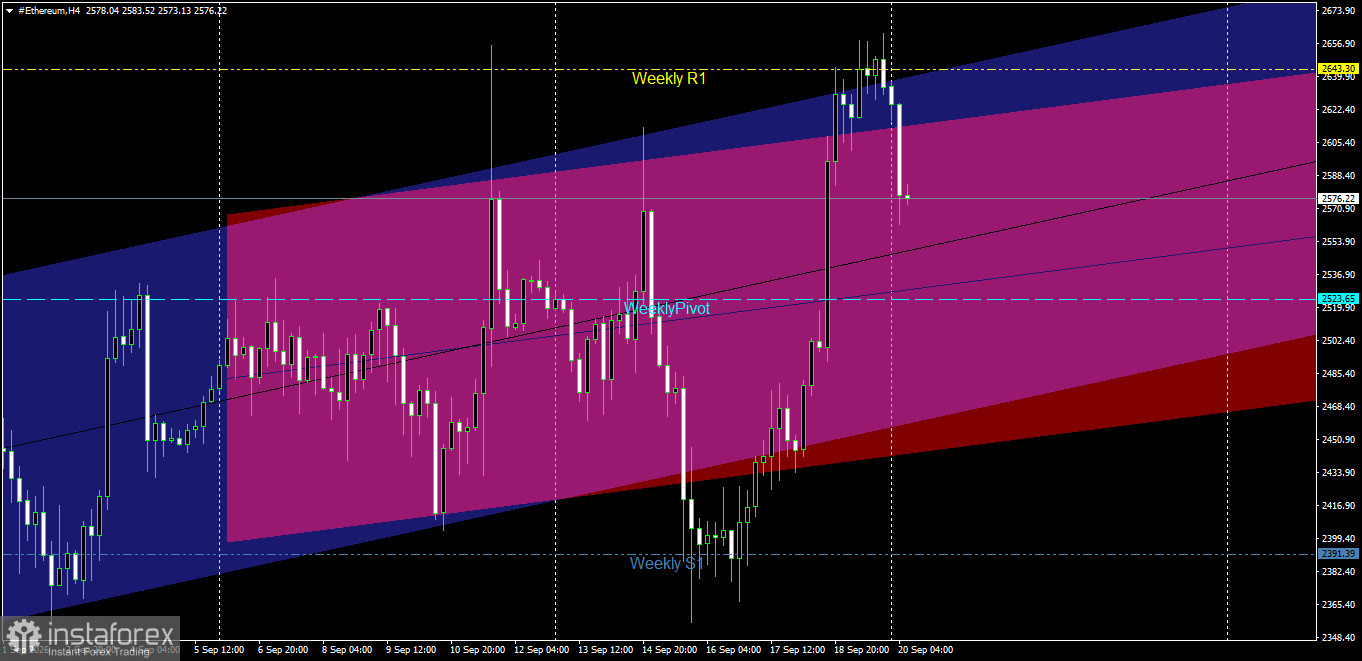
Examining the 4-hour chart, we observe the price continuing to trade within an ascending channel (indicated by the purple and red zones). This geometric formation defines the immediate price movement throughout September, with the chart displaying a pattern of progressively higher lows alongside higher highs.
Between September 15 and 18, the price experienced a sharp, near-vertical ascent from lows near the channel's lower boundary, as buyers drove prices up with strong, consecutive bullish candles. This rapid surge enabled the price to break through the channel's midline and sub-channel, eventually touching the upper range of the price channel near weekly resistance levels.
Support, Resistance, and Weekly Pivot Levels
The technical analysis for this timeframe relies on weekly pivot levels clearly marked on the chart:
Weekly Resistance 1 (Weekly R1):Situated at approximately $2,643.30 (indicated by the dashed yellow line). This level marks the current peak from which the price recently retraced following a failed breakout attempt, making it the primary supply zone in the near term. Current Price: The price is currently trading around the $2,576.22 level, following a corrective wave and a sharp drop from the previous peak.
Weekly Pivot Point: Located at $2,523.65 (indicated by the light blue dashed line). This area currently represents the most critical retest level, acting as the dividing line between the bullish and bearish zones for upcoming price action.
Weekly Support 1 (Weekly S1): Located at $2,391.39 (indicated by the lower blue dashed line). This level represents the solid price base from which the price launched its recent upward rally around the middle of the month.
Price Action Analysis and Current Correction
The chart shows that the price experienced a strong surge, briefly surpassing the $2,643.30 level and hitting a peak near $2,673.90. However, intense profit-taking quickly emerged, resulting in a sharp bearish candle that pulled the price back within the channel range, below the first weekly resistance level.
Despite this rapid correction, the price continues to trade above the weekly pivot point ($2,523.65) and above the main midline of the ascending channel; this indicates that the bullish trend structure on the 4-hour timeframe remains intact and has not been broken. Price Action Outlook and Potential Scenarios
Based on the technical data shown on the chart, two potential price action scenarios can be identified for the upcoming sessions:
1. Bullish Scenario (Resumption of the Uptrend):
This scenario requires the price to successfully stabilize above the weekly pivot point at $2,523.65, coinciding with the channel's midline support. Should the price rebound from these zones—accompanied by the appearance of bullish reversal candlesticks—it would likely re-target the Weekly R1 level at $2,643.30. A breakout and stable close above this level would pave the way for a move toward $2,673.90, setting the stage to reach the $2,700 mark and beyond.
2. Bearish Correction Scenario:
If current selling pressure persists and the price breaks below the weekly pivot point ($2,523.65)—closing beneath it with a strong four-hour candle—it would likely deepen the correction. This move would aim to test the lower boundary of the ascending channel and the Weekly S1 support level at $2,391.39. This zone represents a critical "last chance" for buyers to maintain the overall bullish trend before a shift into a broader bearish trajectory occurs.
Dzięki analizom InstaForex zawsze będziesz na bieżące z trendami rynkowymi! Zarejestruj się w InstaForex i uzyskaj dostęp do jeszcze większej liczby bezpłatnych usług dla zyskownego handlu.


