 Anuluj

Warunki handlowe
Narzędzia


The 4-hour (H4) chart for Gold (GOLD) shows price movements influenced by a primary bearish channel; the price is currently trading at the 4143.37 level, near the lower boundary of a target fluctuation range within an intraday continuation triangle pattern.
Technical Analysis and Price Action
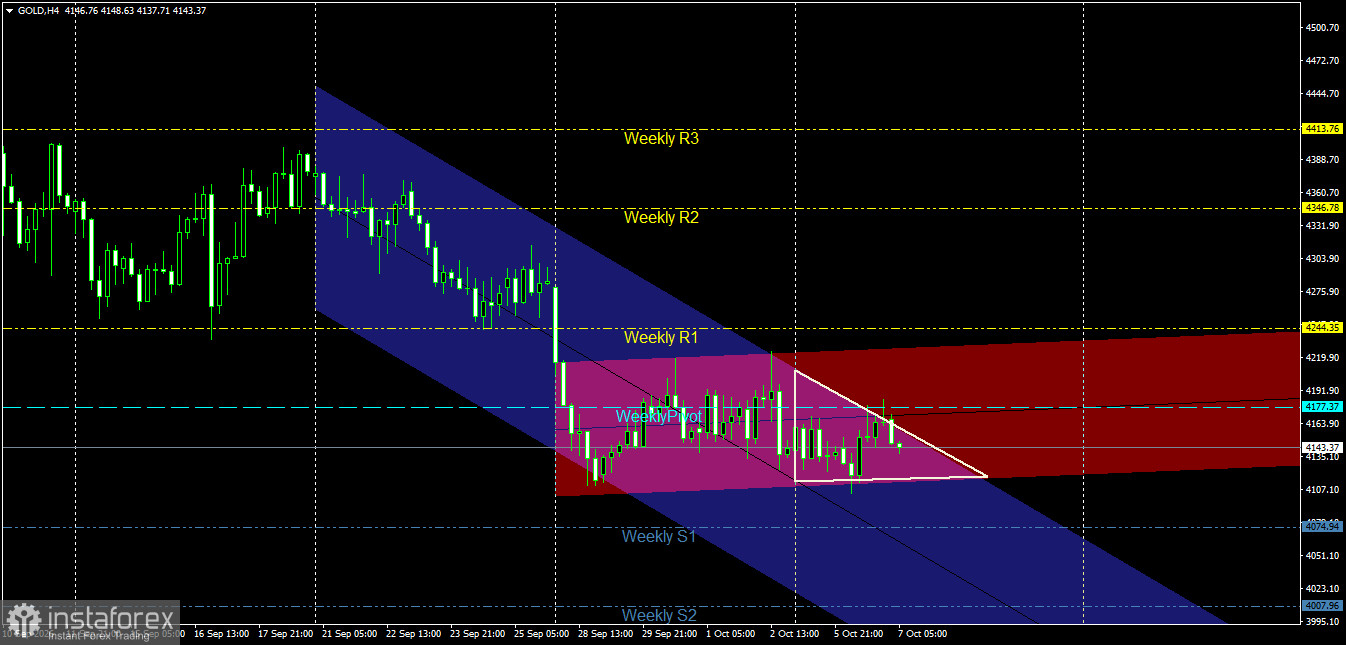
Price Channel Structure: The price is moving within a primary bearish channel (blue), reflecting the overall downward trend that began following the decline from the third weekly resistance level (Weekly R3) at 4413.76 and the second resistance level (Weekly R2) at 4346.78. Concurrently, a secondary path (pink/red) is forming, overlapping with the primary channel and exerting pressure on price action.
Consolidation Triangle Pattern: The chart displays the formation of a triangle pattern (outlined in white) at the end of the most recent bearish wave, with the price currently positioned near the triangle's lower boundary.
Interaction with Pivot Levels: The price is currently fluctuating below the Weekly Pivot point at 4177.37 and the first weekly resistance level (Weekly R1) at 4244.35. This fluctuation indicates that buyers have so far failed to break above the Weekly Pivot, keeping selling pressure as the dominant force.
Key Support and Resistance Levels
Key Resistance Levels:
First Resistance: 4177.37 (Weekly Pivot point). Second Resistance: 4244.35 (Weekly R1).
Pivot Resistance: 4346.78 (Weekly R2).
Key Support Levels:
First Support: 4135.10 – 4143.37 (lower triangle boundary and intraday lows).
Second Support: 4074.94 (Weekly S1).
Key Support: 4007.96 (Weekly S2).
Price Action Outlook and Trading Recommendations
Bearish Scenario (Primary):
A bearish trend is the most likely outcome as long as the price trades below the weekly pivot of 4177.37 and breaks the lower triangle boundary.
Recommendation: Sell upon a break and 4-hour candle close below 4135.10, or upon a retest of the weekly pivot at 4177.37 where resistance holds.
Technical Targets: Target the first weekly support level at 4074.94 initially, extending toward 4007.96 if selling pressure intensifies.
Stop Loss: 4-hour candle close above 4191.90.
Bullish Corrective Scenario (Alternative):
Triggered if the price successfully breaks above the upper triangle boundary and surpasses the weekly pivot point of 4177.37. Confirmation condition: Breaking above 4177.37 and holding above it with a 4-hour candle.
Technical targets: Initiation of a positive corrective wave targeting the first weekly resistance at 4244.35.
The H1 chart for Gold (GOLD) reveals a pivotal shift in price action following a corrective upward wave; the price is currently trading around the 4143.06 level, having broken below the intraday bullish trend and key pivot points.
Technical Analysis and Price Action
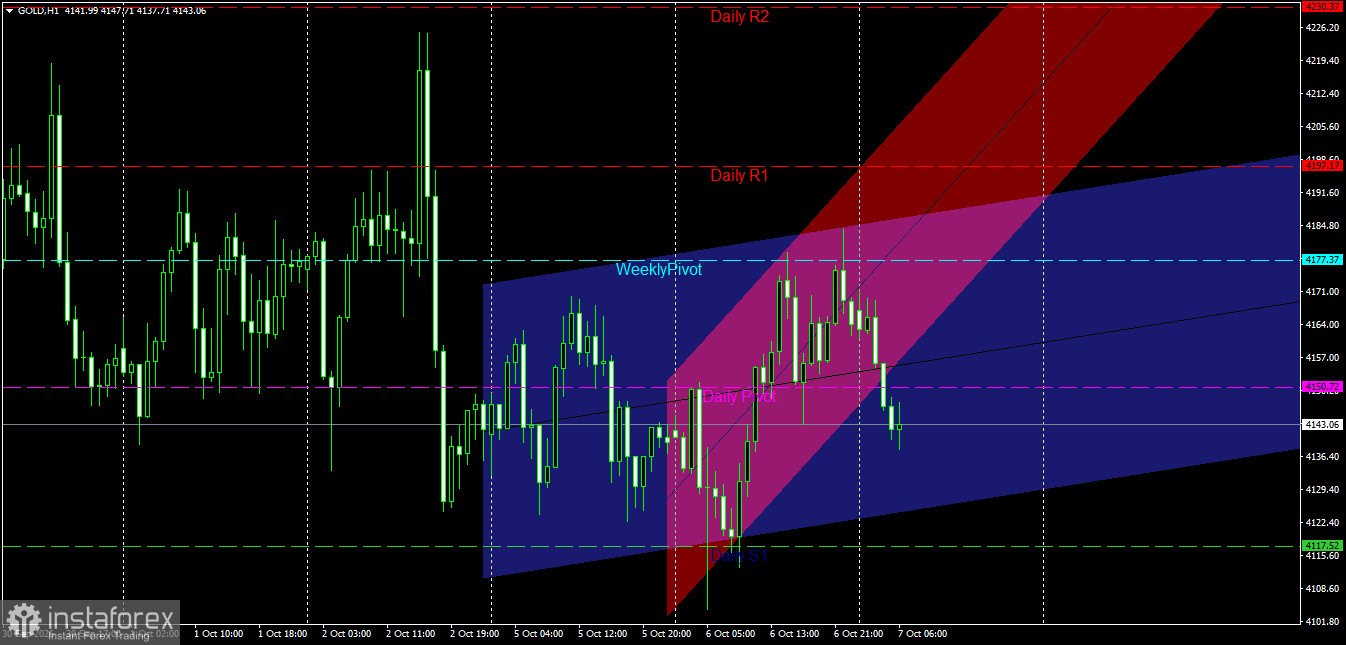
Price Channel Structure: The price is trading within a primary, gently sloping bullish channel (blue), reflecting recent recovery attempts. However, it has clearly broken out of the steeper, high-momentum bullish sub-channel (pink/red)—which had previously driven repeated tests of the Weekly Pivot at 4177.37. This downward break of the sub-channel indicates that sellers have regained intraday control.
Interaction with Pivot Levels: After failing to breach the first daily resistance level (Daily R1) at 4197.17 and pulling back from the Weekly Pivot at 4177.37, the price slid sharply, breaking below the Daily Pivot at 4150.72. Trading below the Daily Pivot transforms it into an intraday resistance level, exerting downward pressure on the price.
Key Support and Resistance Levels
Key Resistance Levels:
Resistance 1: 4150.72 (Daily Pivot).
Resistance 2: 4177.37 (Weekly Pivot). Key Resistance: Level 4197.17 (Daily R1).
Key Support Levels:
First Support: Levels 4115.60 – 4117.52 (Daily S1 and the lower boundary of the main channel).
Second Support: Level 4101.80 (a pivotal recent low).
Key Support: Level 4086.00 (in the event of intensified selling pressure).
Price Action Outlook and Trading Recommendations
Bearish Scenario (Primary):
A bearish trend is the most likely outcome in the intraday timeframe, provided the price remains below the daily pivot level of 4150.72 and following the exit from the minor ascending channel.
Recommendation: Sell upon a retest of the 4150.72 level if resistance holds, or upon a break of the nearby intraday low.
Technical Targets: Target the Daily S1 support zone at 4115.60 – 4117.52 as the primary target, extending toward 4101.80 if selling pressure persists.
Stop Loss: A one-hour candle close above the 4164.00 level.
Bullish Corrective Scenario (Alternative):
This scenario activates if the price breaks back above the daily pivot level of 4150.72 and establishes support there with a strong one-hour candle.
Confirmation Condition: Breaking 4150.72 and holding above it. Technical Targets: Targeting the weekly pivot at 4177.37; should strength persist, trading may extend toward the first daily resistance level at 4197.17.
Risk Management
Trading gold amidst current volatility requires strict adherence to capital management rules, limiting risk exposure to no more than 1%–2% of the total trading account and precisely setting stop-loss orders.
Dzięki analizom InstaForex zawsze będziesz na bieżące z trendami rynkowymi! Zarejestruj się w InstaForex i uzyskaj dostęp do jeszcze większej liczby bezpłatnych usług dla zyskownego handlu.


