 Anuluj
Warunki handlowe
Narzędzia


Trend Analysis
In August, the price from the level of 1.3203 (closing of the July monthly candle) may begin to move upward toward the target of 1.3539 – the 14.6% retracement level (red dashed line). Upon testing this level, the price may pull back downward toward the 23.6% retracement level at 1.3386 (red dashed line).
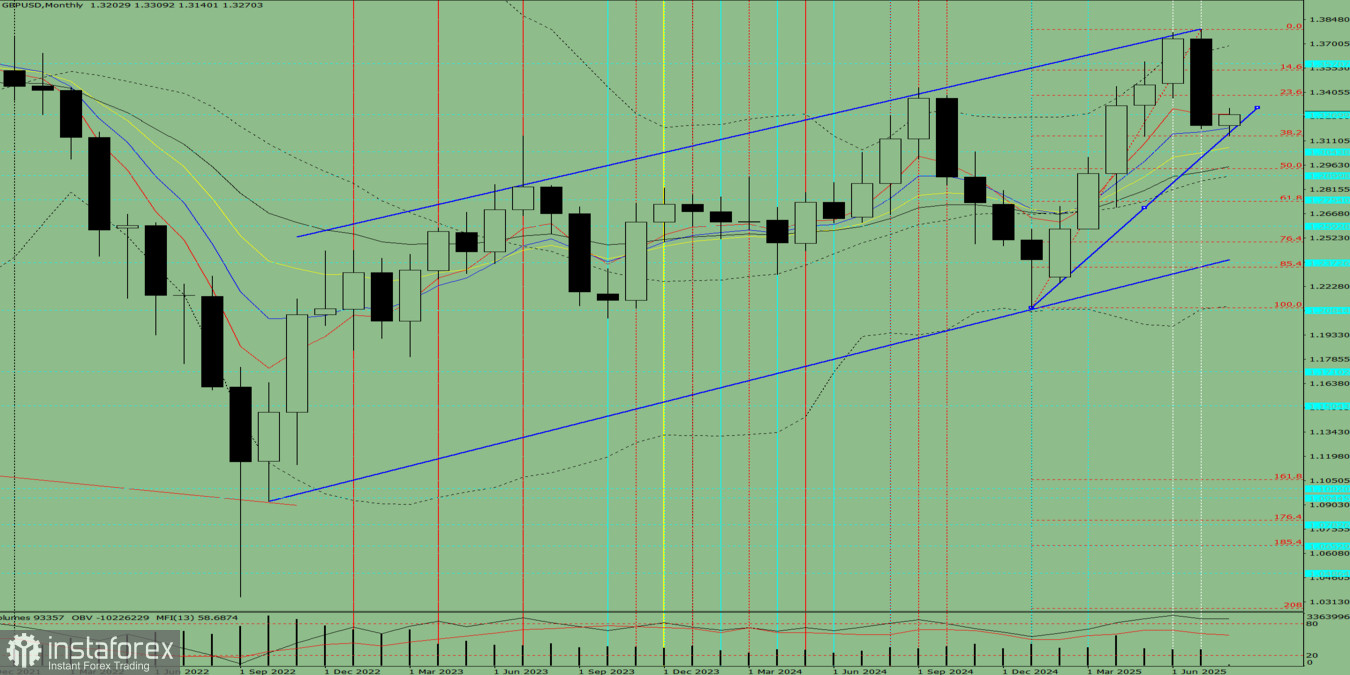
Fig. 1 (Monthly Chart)
Indicator Analysis:
Conclusion based on comprehensive analysis: a potential upward trend.
General forecast for the GBP/USD monthly candle: The price is likely to show an upward trend, with no lower shadow on the monthly white candle (first week of the month – bullish), and an upper shadow (last week of the month – bearish).
Alternative Scenario: From the level of 1.3203 (closing of the July monthly candle), the price may begin to move upward toward the target of 1.3789 – upper fractal (red dashed line). Upon testing this level, the price may pull back downward toward 1.3591 – historical resistance level (blue dashed line).
Dzięki analizom InstaForex zawsze będziesz na bieżące z trendami rynkowymi! Zarejestruj się w InstaForex i uzyskaj dostęp do jeszcze większej liczby bezpłatnych usług dla zyskownego handlu.


