 Anuluj
Warunki handlowe
Narzędzia


On Friday, the EUR/USD pair made another rebound from the resistance level of 1.1795–1.1802, the fourth in a row. Thus, during the holiday period, the bulls did not have enough strength to break through this zone. A reversal in favor of the U.S. currency took place, and a decline toward the Fibonacci level of 38.2% at 1.1718 began. A consolidation of prices above the 1.1795–1.1802 level would favor the European currency and increase the likelihood of continued growth toward the next corrective level of 0.0% at 1.1919.
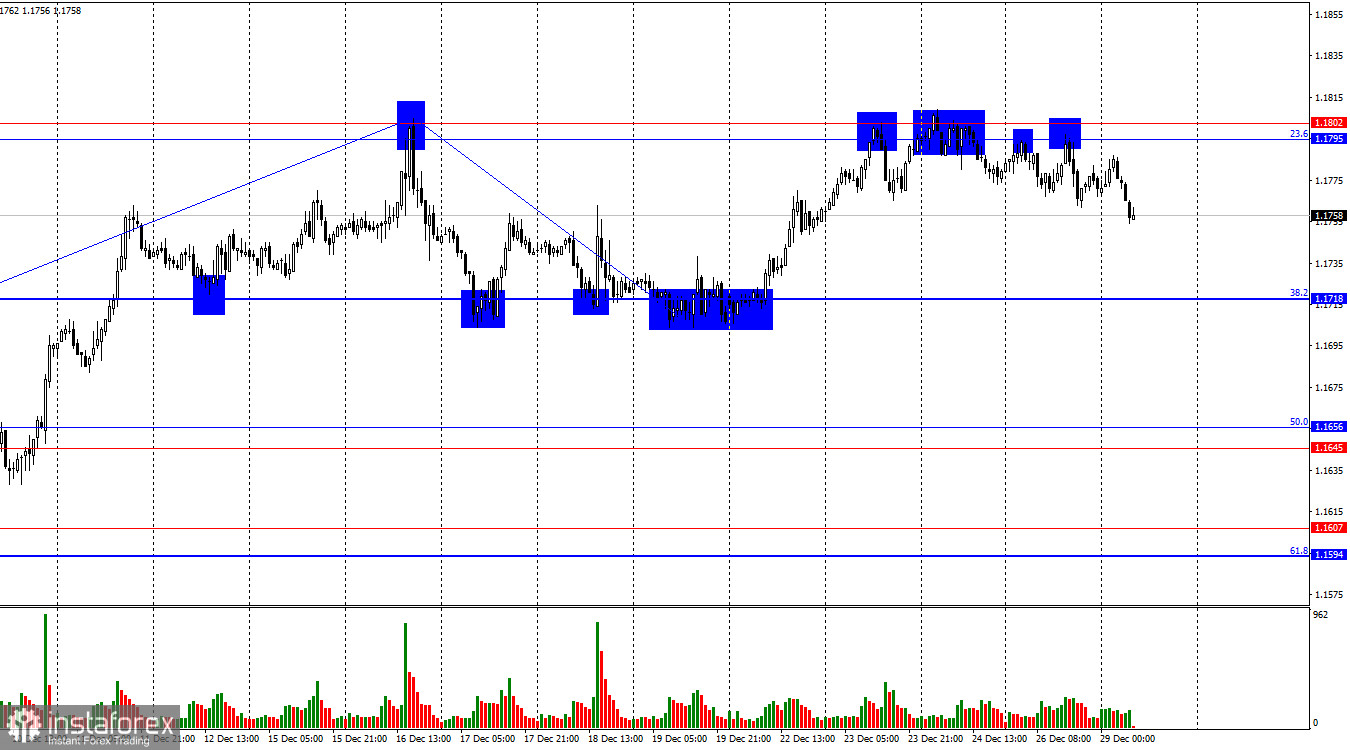
The wave picture on the hourly chart remains simple. The most recently completed upward wave broke the peak of the previous wave, while the most recent downward wave did not break the previous low. Thus, the trend officially remains "bullish." It would be hard to call it strong, but in recent weeks the bulls regained confidence, and then the holidays began. Easing of the Fed's monetary policy will put pressure on the dollar in 2026, and the ECB will not create any problems for the euro.
On Friday, the news background in the U.S. and the European Union was absent, and both the entire past week and the current week are more holiday-oriented than working ones. The only reports released during the past week were U.S. GDP, durable goods orders, and industrial production. In my view, the most important report was and remains GDP, as it reflects growth in the entire U.S. economy. However, traders reacted coolly to this report, despite growth of 4.3% against much more pessimistic forecasts. This report did not provide significant support to the dollar, and rightly so, because throughout December the U.S. released economic data that were painful to look at. "Dovish" sentiment in the market continues to grow; traders believe that in 2026 the Fed will cut interest rates far more than once, contrary to what Jerome Powell has been assuring. The U.S. economy is growing, but many other indicators are showing negative dynamics. The labor market remains the biggest concern. Unemployment is rising, and inflation opens the door for the FOMC to further ease monetary policy. In such a situation, even a GDP report will not help.
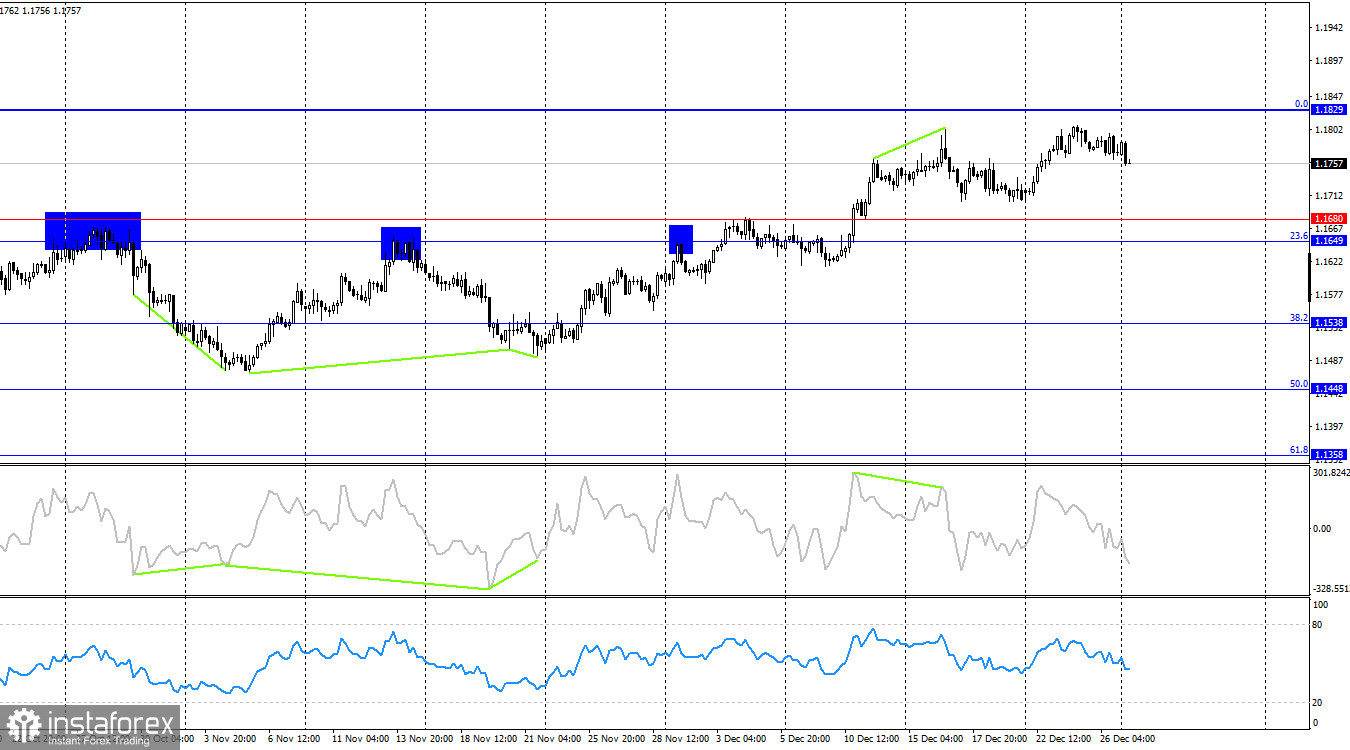
On the 4-hour chart, the pair has reversed in favor of the European currency and resumed growth toward the corrective level of 0.0% at 1.1829. A rebound from this level would favor the U.S. dollar and lead to some decline toward the support level of 1.1649–1.1680. A consolidation above 1.1829 would increase the likelihood of further euro growth. No emerging divergences are observed on any indicators today.
Commitments of Traders (COT) Report:
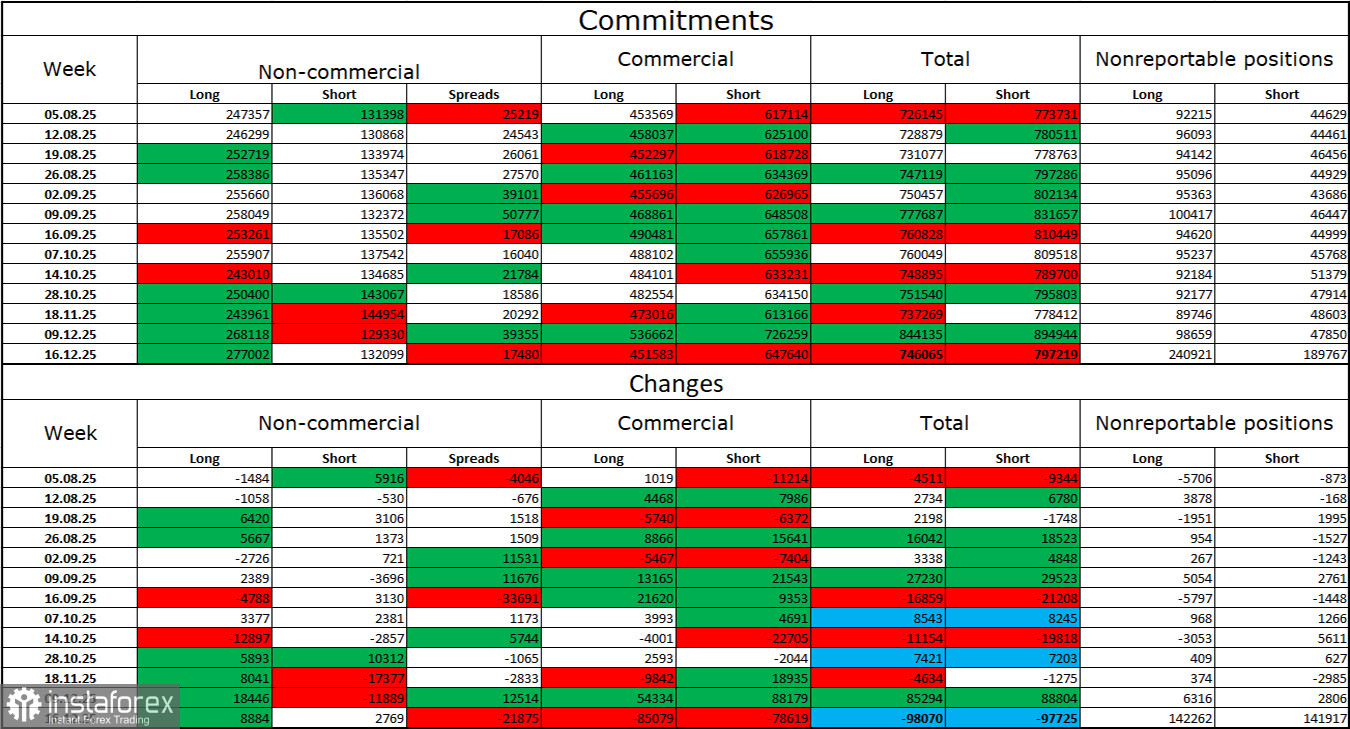
During the latest reporting week, professional traders opened 8,884 long positions and 2,769 short positions. Sentiment among the "Non-commercial" group remains bullish thanks to Donald Trump and his policies, and continues to strengthen over time. The total number of long positions held by speculators now stands at 277 thousand, while short positions amount to 132 thousand. This represents more than a twofold advantage for the bulls.
For thirty-three consecutive weeks, large players were reducing short positions and increasing long ones. Then the "shutdown" began, and now we see the same picture again: bulls continue to add long positions. Donald Trump's policies remain the most significant factor for traders, as they cause numerous problems that will have long-term and structural consequences for the United States, such as the deterioration of the labor market. Traders fear a loss of the Fed's independence in 2026 under pressure from Trump and amid Jerome Powell's resignation in May.
News Calendar for the U.S. and the Eurozone:
On December 29, the economic calendar contains no scheduled events. The influence of the news background on market sentiment on Monday will be absent.
EUR/USD Forecast and Trading Advice:
Selling the pair was possible on a rebound from the 1.1795–1.1802 level on the hourly chart, with a target of 1.1718. These trades can be kept open today. Buy trades can be opened upon a close above the 1.1795–1.1802 level, with a target of 1.1919.
Fibonacci grids are drawn from 1.1392–1.1919 on the hourly chart and from 1.1066–1.1829 on the 4-hour chart.
Dzięki analizom InstaForex zawsze będziesz na bieżące z trendami rynkowymi! Zarejestruj się w InstaForex i uzyskaj dostęp do jeszcze większej liczby bezpłatnych usług dla zyskownego handlu.


