 Anuluj
Warunki handlowe
Narzędzia


Bitcoin has been trading in another sideways range for three weeks and shows no intention of leaving it. During the holidays, volatility in the crypto market is minimal, and the market moves purely sideways. On the 4-hour timeframe, Bitcoin remains inside the sideways channel that began forming on December 1. Inside the range, trading opportunities can be sought only near its boundaries. Over the last three weeks, signals were received near the upper boundary — two deviations. When a deviation forms near the lower boundary, an upward move can be expected. However, recall that we are primarily interested in sell signals rather than buy signals, since the trend remains downward. Until Bitcoin exits the sideways channel, all internal patterns are irrelevant.
In a longer-term perspective (daily TF), we see a correction that may already be complete. However, one cannot be 100% certain about this because no sell signals have been received. The price only removed the liquidity for sale, but in the last month, it has traded more sideways than down or up. Thus, in the near term, trading is possible only from the boundaries of the sideways channel on the 4-hour TF.
On the weekly TF, Bitcoin must fall below $75,000 for the uptrend that began in 2022 to be officially considered finished. Only below $75,000 can one confidently state the "bullish" structure is broken. If that happens, the fall of Bitcoin could take several years.

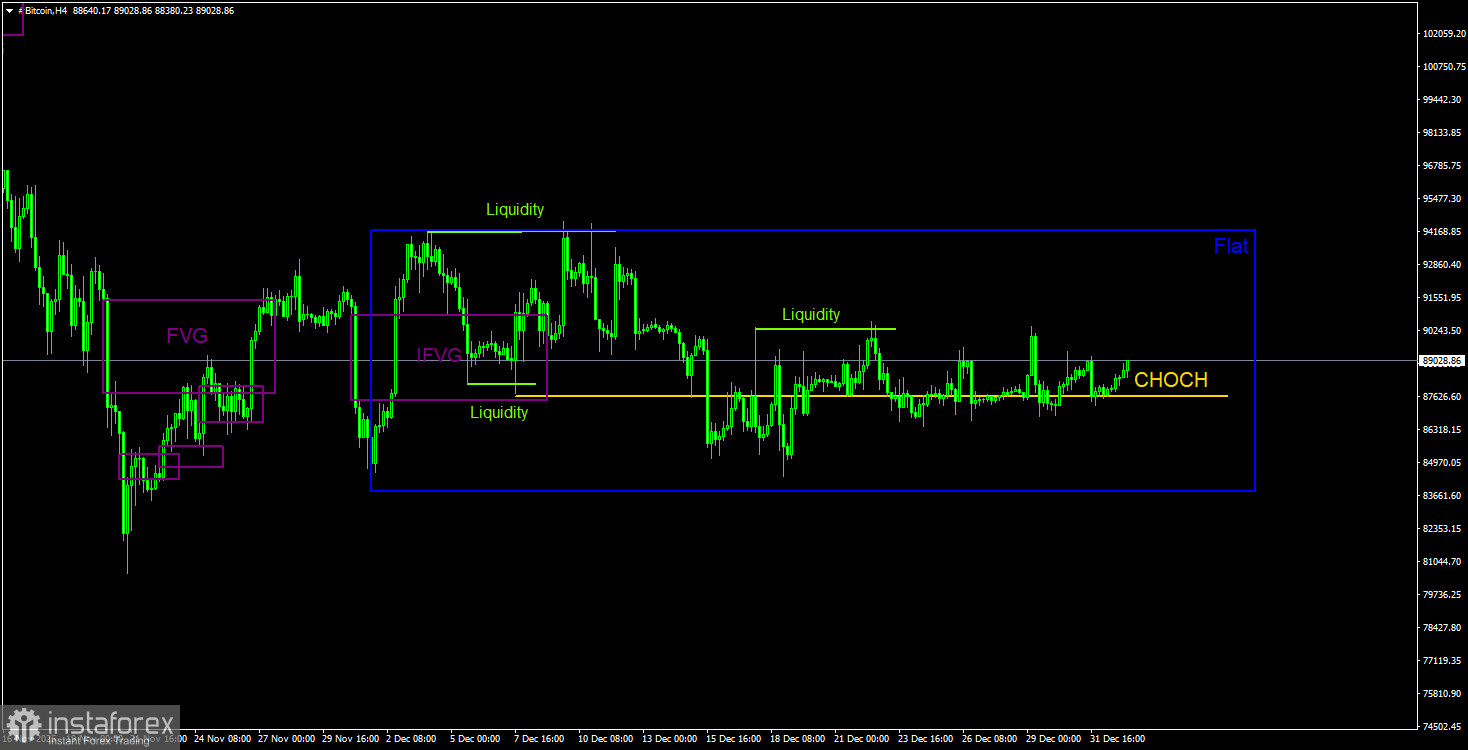
On the 4-hour TF, the technical picture also unambiguously indicates a downward trend, while the price remains in a sideways channel. The CHOCH line (trend break) that ran at $87,600 has been breached, meaning the short-term upward tendency is broken. However, inside the range, local trends do not matter. In the near term, traders can only trade from the boundaries of the sideways channel. From our point of view, sell signals are far more attractive than buy signals. Formally, two sell signals have already been formed. But that signal can already be considered worked out, since more than two weeks have passed since it was formed. On December 18, the price approached the lower line of the channel closely.
Bitcoin broke the upward structure on the daily TF and, for the first time in three years, began forming a full downward trend. The two nearest targets (the bullish OB in the $98,000–$102,700 area and the bullish FVG) have been worked out; now one should expect a fall to $70,800 (the 50.0% Fibonacci level of the three-year uptrend). Among the POI areas for selling, the only one to highlight is the nearest bearish FVG on the daily TF, located in the $96,800–$98,000 area, which Bitcoin has not yet reached. On the 4-hour TF, one can consider opening positions after new deviations form.
CHOCH — change of trend structure (trend break).
Liquidity — liquidity, traders' Stop Losses, which market-makers use to accumulate their positions.
FVG — area of price inefficiency (Fair Value Gap). Price moves through such areas quickly, indicating the absence of one side in the market. Subsequently, the price tends to return and react to these areas.
IFVG — inverted Fair Value Gap. After returning to such an area, the price does not get a reaction but breaks impulsively, then tests it from the other side.
OB — Order Block. The candle is where a market-maker opened a position with the aim of taking liquidity to form their own position in the opposite direction.
Dzięki analizom InstaForex zawsze będziesz na bieżące z trendami rynkowymi! Zarejestruj się w InstaForex i uzyskaj dostęp do jeszcze większej liczby bezpłatnych usług dla zyskownego handlu.


