 Anuluj
Warunki handlowe
Narzędzia


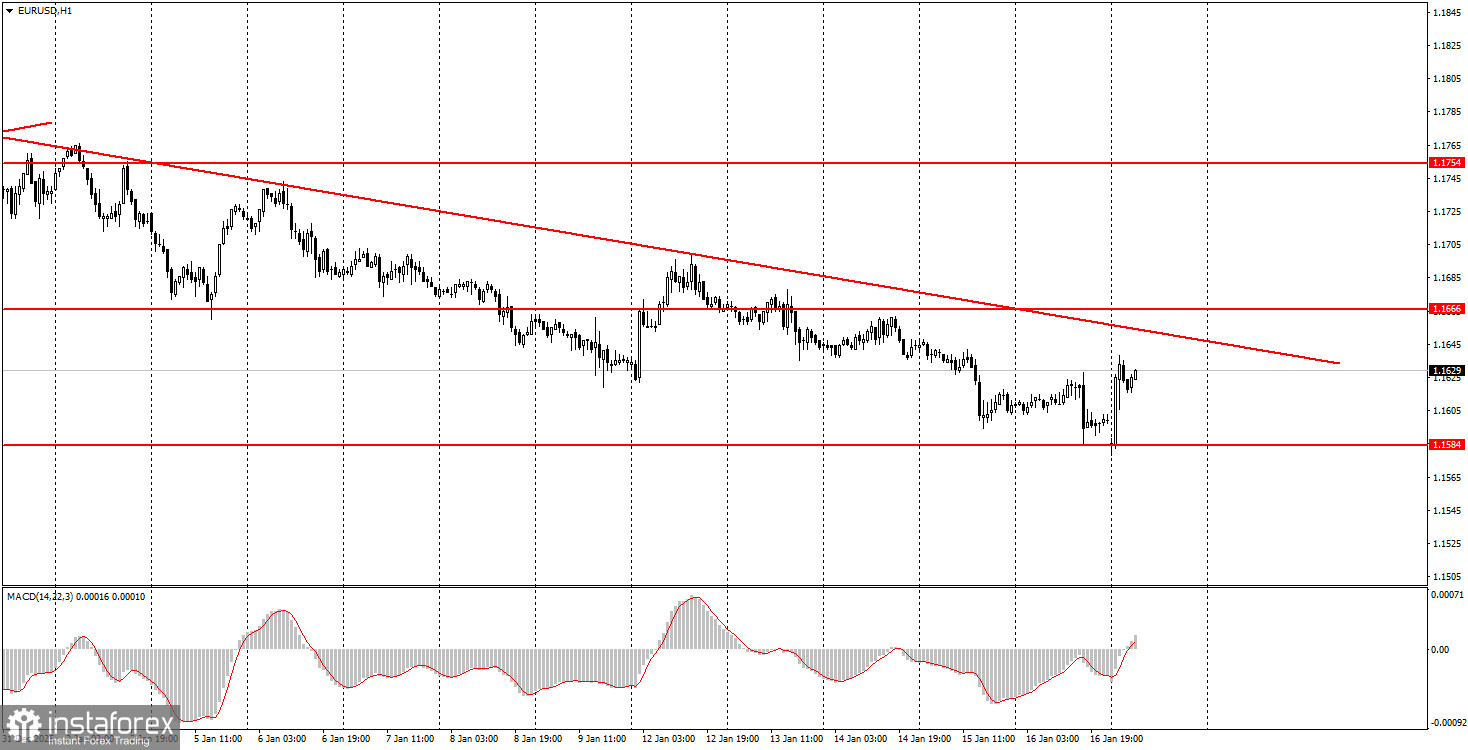
The EUR/USD currency pair maintains a downward trend on the hourly TF. Recall that the key point for the euro was and is the flat on the daily TF, which has lasted for 7 months. It was after the upper boundary of the 1.1400–1.1830 sideways channel was worked off that the pair reversed down and has been falling for three weeks straight. On Friday, we saw a sharp drop in quotes, which was offset by a strong rise on Monday night. But were those moves really strong? On Friday, the pair fell 40 pips within an hour, and the total daily volatility was 45 pips. On Monday, the euro rose 45 pips within an hour. So on the charts, those two moves may look impressive, while actual market volatility remains low. On Friday, only the US industrial production report could have provoked a sharp strengthening of the US dollar. Industrial output increased month-on-month by 0.4%, slightly above experts' forecasts. There were no other important events or reports during the day.
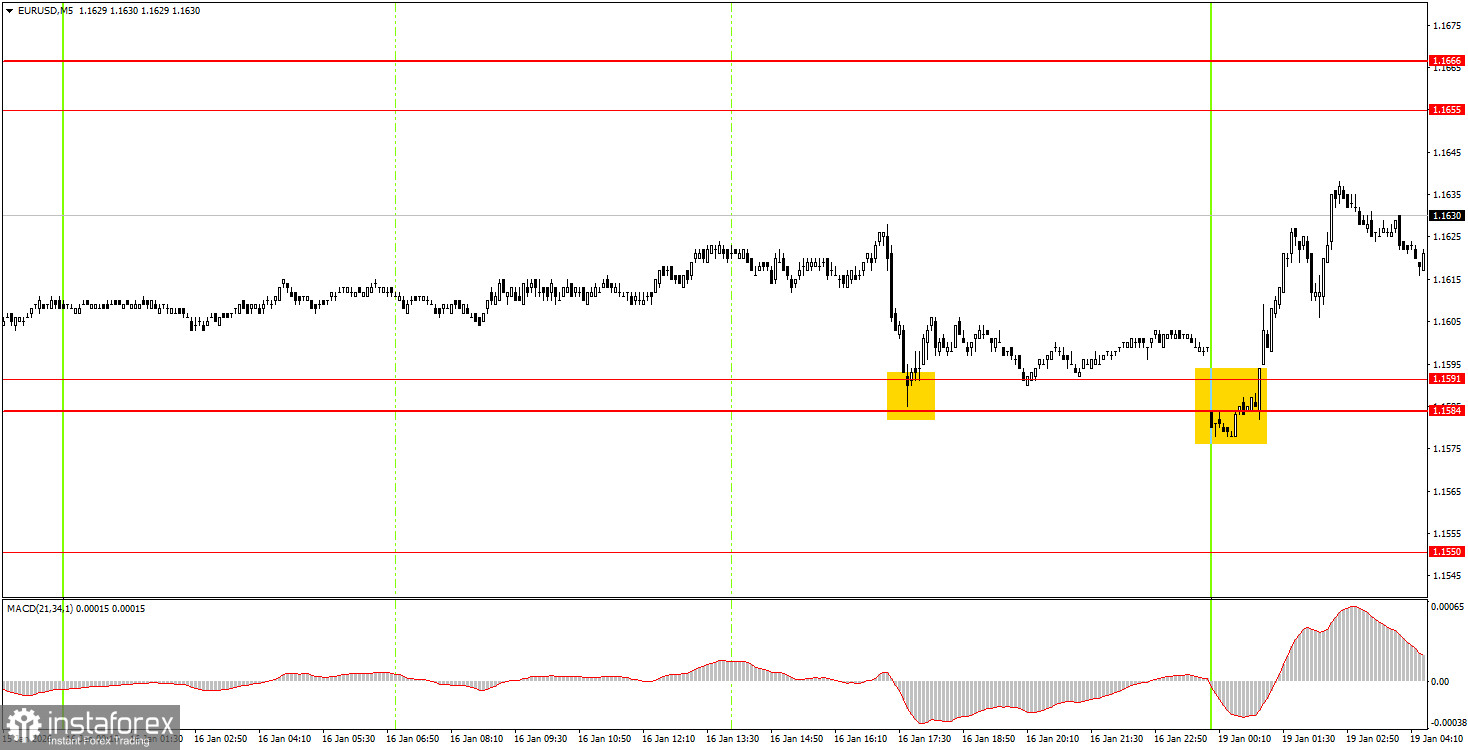
On the 5-minute TF on Friday, one buy signal was formed. During the US session price worked in the 1.1584–1.1591 area, but by the end of the trading day and week could not show any growth. However, on Monday, the price once again bounced from that area, forming another buy signal. Target — the 1.1655–1.1666 area.
On the hourly timeframe, the downtrend continues to form, as evidenced by the trendline. It failed to overcome the 1.1800–1.1830 area, which is the upper boundary of the flat on the daily TF, so the decline is technically natural and may continue down to the 1.1400 level. The overall fundamental and macroeconomic backdrop remains very weak for the US dollar, but the flat on the daily TF plays the priority role, and traders pay virtually no attention to the macroeconomic backdrop.
On Monday, beginner traders could open long positions from the 1.1584–1.1591 area, targeting 1.1655–1.1666. A bounce of price from the 1.1655–1.1666 area would make shorts relevant with a target of 1.1584–1.1591.
On the 5-minute TF, consider the levels 1.1354–1.1363, 1.1413, 1.1455–1.1474, 1.1527–1.1531, 1.1550, 1.1584–1.1591, 1.1655–1.1666, 1.1745–1.1754, 1.1808, 1.1851, 1.1908, 1.1970–1.1988. Today, the EU will publish the second estimate of December inflation, while the US events calendar is empty. The second inflation estimate is always less important than the first, so we do not expect a market reaction to this report.
Support and resistance price levels — levels that serve as targets when opening buys or sells. Take Profit can be placed near them.
Red lines — channels or trendlines that reflect the current tendency and show which direction is preferable to trade now.
MACD indicator (14,22,3) — histogram and signal line — an auxiliary indicator that can also be used as a source of signals.
Important speeches and reports (always listed in the news calendar) can strongly affect a currency pair's movement. Therefore, during their release, trading should be done with maximum caution, or positions should be closed, to avoid a sharp price reversal against the preceding move.
Beginner forex traders should remember that not every trade can be profitable. Developing a clear strategy and effective money management are the keys to long-term trading success.
Dzięki analizom InstaForex zawsze będziesz na bieżące z trendami rynkowymi! Zarejestruj się w InstaForex i uzyskaj dostęp do jeszcze większej liczby bezpłatnych usług dla zyskownego handlu.


