 Anuluj
Warunki handlowe
Narzędzia


On Friday, the EUR/USD pair continued its upward movement and by the end of the day reached the 127.2% corrective level at 1.1867 based on the new Fibonacci grid. A rebound from the 1.1867 level would favor the U.S. dollar and lead to a moderate decline toward the support level of 1.1802–1.1805. A consolidation of the pair above 1.1867 would increase the probability of continued growth toward the next corrective level at 161.8% – 1.1945.
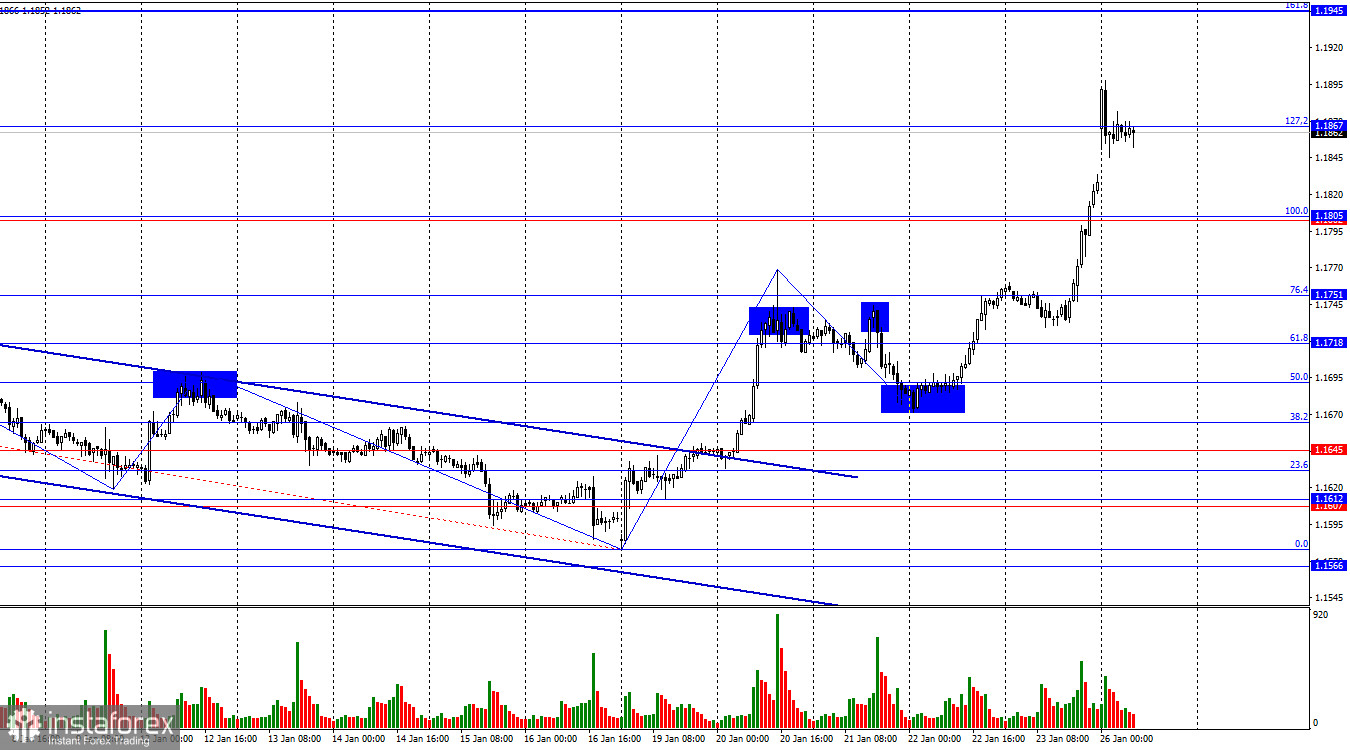
The wave structure on the hourly chart remains straightforward. The last completed downward wave failed to break the low of the previous wave, while the most recent upward wave broke the previous high. Thus, the trend remains bullish. The bulls have launched a new offensive, which might not have happened without Donald Trump. Trump has escalated tensions around Greenland to the extreme, and the markets reacted by fleeing the risky U.S. asset with uncertain economic prospects.
On Friday, the U.S. dollar could have expected some recovery, but instead it collapsed across the market. Some experts attributed the latest decline of the U.S. currency to foreign exchange interventions; however, I believe geopolitics was the main factor last week. This week, traders may shift their attention to the Federal Reserve meeting. It will conclude on Wednesday evening, and according to most experts, no changes to monetary policy parameters are expected.
Let me remind you that the FOMC carried out three rounds of easing in the second half of 2025, after which Jerome Powell announced the need to pause and give lower rates time to fully take effect. Thus, traders do not expect further monetary easing in the first half of 2026. This does little to help the dollar, and if it becomes known this week that the Fed is still considering another rate cut, the market will sell the dollar with renewed force. At the beginning of the current year, the U.S. currency is under extremely strong—but fully justified—market pressure.
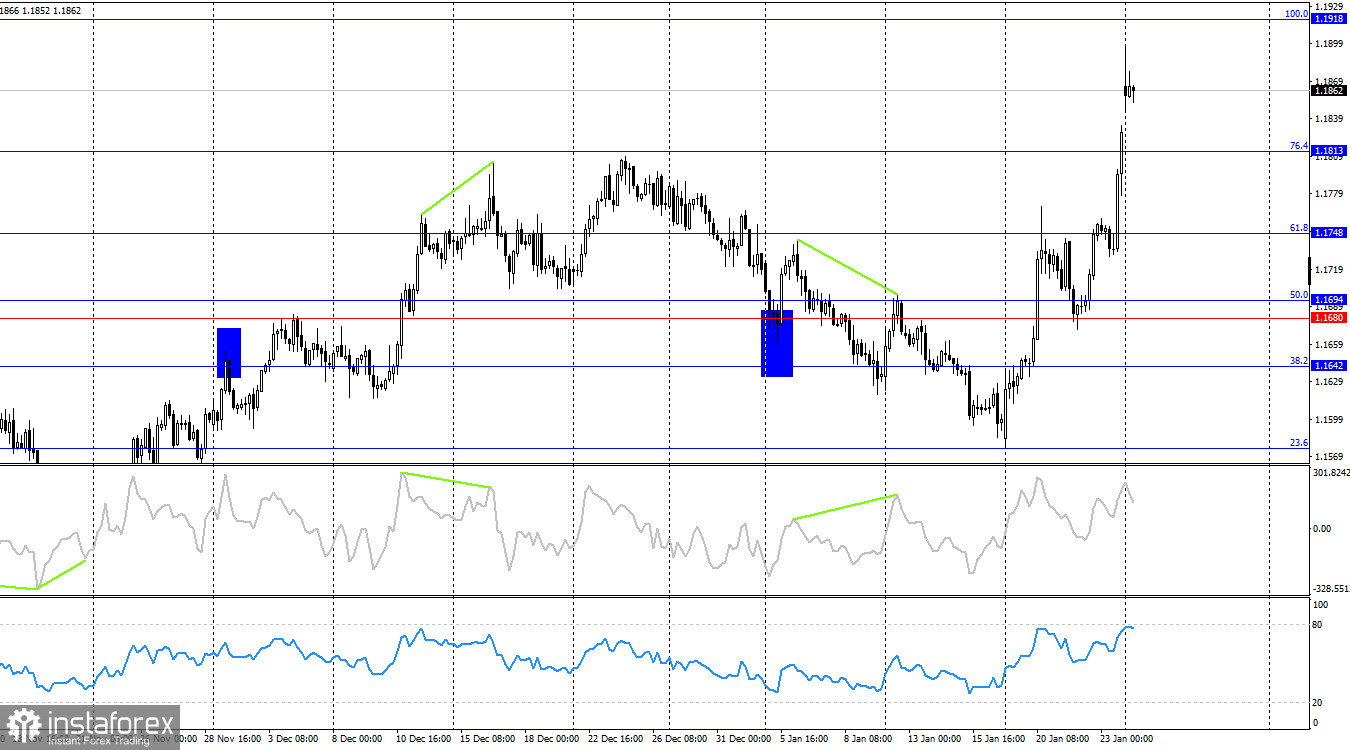
On the 4-hour chart, the pair continues to rise and has closed above the 76.4% Fibonacci level at 1.1813. Thus, the upward movement may continue toward the next Fibonacci level at 100.0% – 1.1918. A consolidation below 1.1813 would favor the U.S. dollar and result in a moderate decline toward the 61.8% corrective level at 1.1748. No developing divergences are observed on any indicator today.
Commitments of Traders (COT) Report:
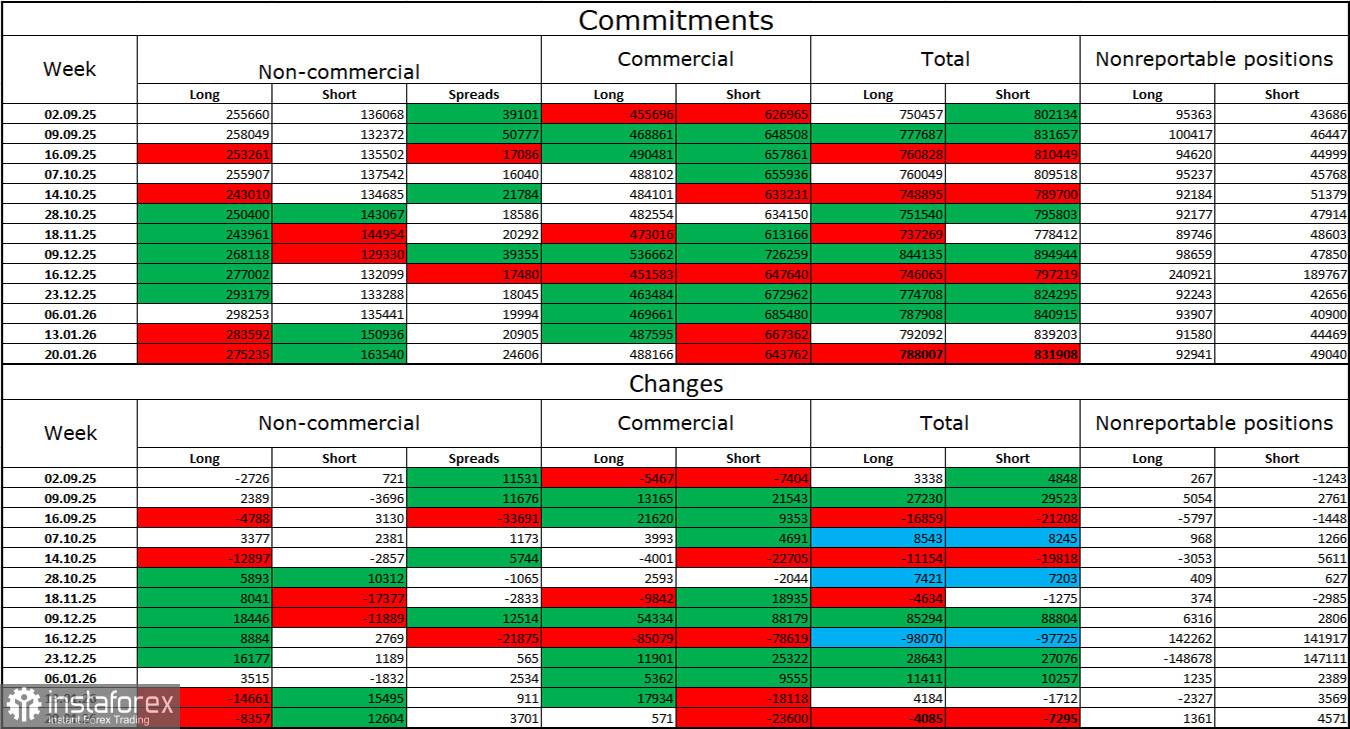
During the latest reporting week, professional traders closed 8,357 long positions and opened 12,604 short positions. The sentiment of the non-commercial group remains bullish thanks to Donald Trump and his policies, and continues to strengthen over time. The total number of long positions held by speculators now stands at 275,000, while short positions amount to 163,000, giving bulls nearly a twofold advantage.
For thirty-three consecutive weeks, large players were reducing short positions and increasing longs. Then the shutdown began, and now we are seeing the same picture again: professional traders continue to build long positions. Donald Trump's policies remain the most significant factor for traders, as they create numerous problems that will have long-term and structural consequences for the U.S., such as deterioration of the labor market. Traders fear the loss of the Fed's independence in 2026 and Donald Trump's geopolitical ambitions.
News Calendar for the U.S. and the Eurozone:
On January 26, the economic calendar contains two entries, but only the U.S. report is of some interest. The impact of the news background on market sentiment on Monday may be felt in the second half of the day.
EUR/USD Forecast and Trading Advice:
Selling the pair is possible today in the event of a rebound from the 1.1867 level on the hourly chart, with targets at 1.1805 and 1.1751. Buy positions were possible on a rebound from the 1.1686 level on the hourly chart, with targets at 1.1731 and 1.1802—all targets were achieved. New buy positions may be opened after a close above 1.1867, with a target at 1.1945.
Fibonacci grids are drawn from 1.1805–1.1578 on the hourly chart and from 1.1918–1.1471 on the 4-hour chart.
Dzięki analizom InstaForex zawsze będziesz na bieżące z trendami rynkowymi! Zarejestruj się w InstaForex i uzyskaj dostęp do jeszcze większej liczby bezpłatnych usług dla zyskownego handlu.


