 Anuluj
Warunki handlowe
Narzędzia


Bitcoin has staged a kind of rally after a month?long range, but even now, the technical picture does not look like the start of a new uptrend. On the daily TF, it is clear the current move up is a weak correction, and there is a pool of liquidity below that price is likely to revisit with about 90% probability. On the 4?hour TF, you can see how slowly Bitcoin is rising. A fast, sharp fall combined with slow, sluggish gains are classic signs of a downtrend. So, our view remains unchanged.
Meanwhile, barely had Bitcoin rallied in this painful corrective leg than various "crypto experts" started hyping the coin again. For example, analysts claimed the new rise was driven by inflows into Bitcoin ETFs and short covering. Perhaps this is obvious, but inflows do cause price rises — the problem is forecasting the inflow (or outflow), especially in the crypto market. Stating facts about any instrument is easy; forecasting its next move is hard.
The fundamental backdrop worsened for Bitcoin during the past week. Following the start of the Middle East war and a rapid oil rally, central banks expect higher inflation and therefore have abandoned plans for further monetary easing yesterday and the day before. The Bank of England could even raise its key rate in 2026 if inflation spirals out of control. Let me remind you that the softer monetary policy is, the higher the demand for risk assets, because safe investments yield too little. Bitcoin bounced off an ascending trend line during this decline, but we believe that line will be broken in any case.
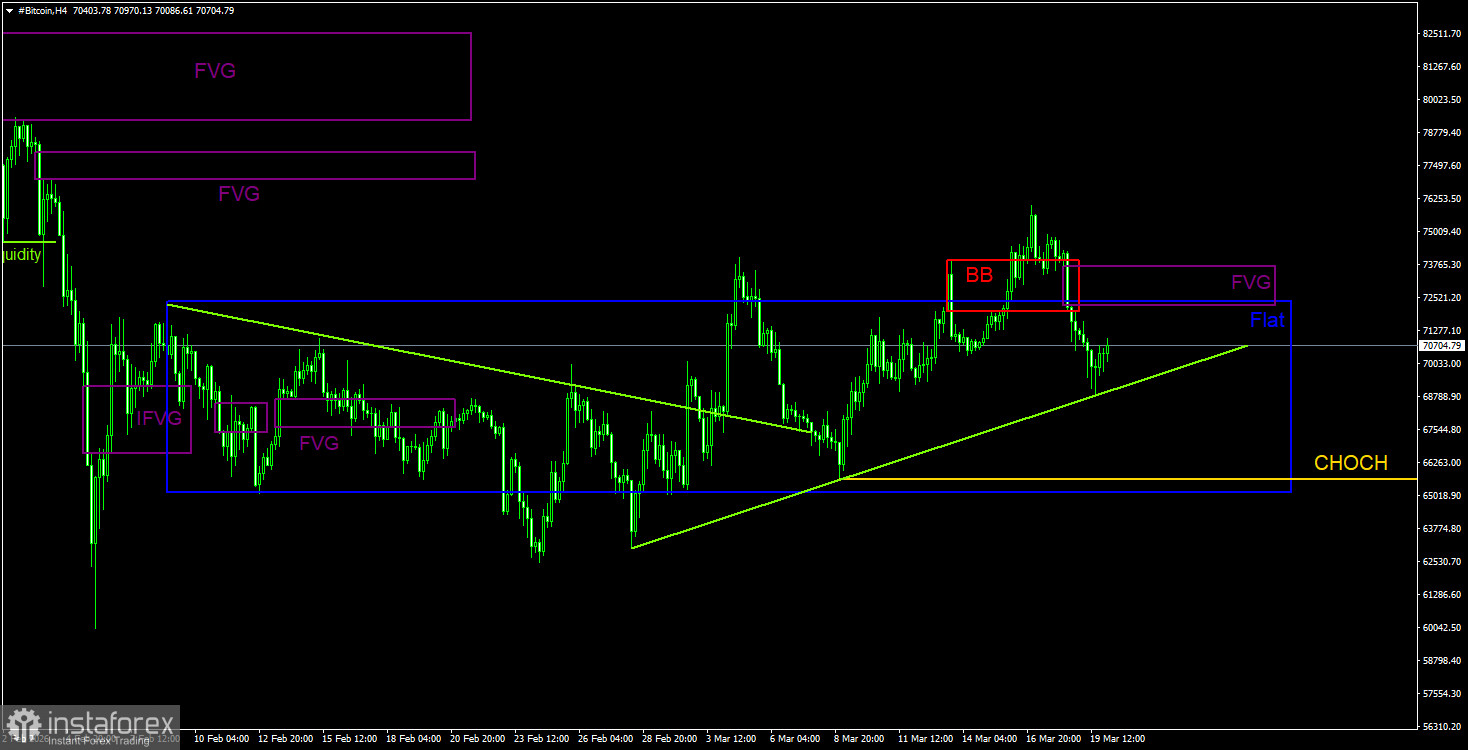
Bitcoin continues forming a full?fledged downtrend. We still expect a decline toward $57,500 (the 61.8% Fibonacci level of the three-year uptrend), and there are currently no signs of a trend reversal. Even $57,500 no longer looks like the final stop. From POI areas, we note only the nearest bearish FVG on the daily TF, which sits quite far from the price. On the 4?hour TF, one could theoretically use the latest FVG to seek sell signals. Below remains an obvious target — the liquidity pool beneath two trend lines.
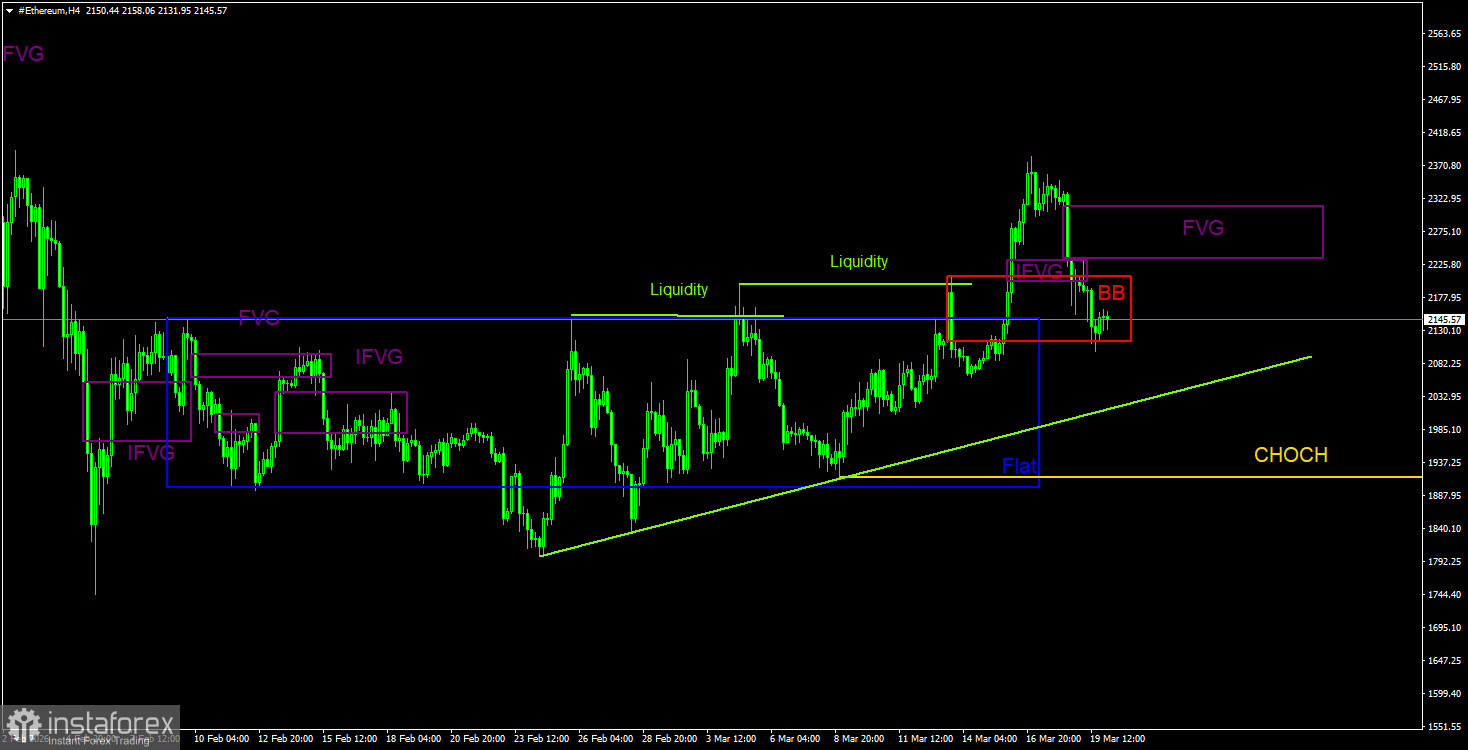
A downtrend is still underway on the daily TF. The key sell pattern remains the bearish order block on the weekly TF. As we warned, the move triggered by that signal can be strong and prolonged. Since its formation, Ethereum has already fallen about 55% (roughly $2,500). In the near term, an upside correction is still possible; the 4?hour order block has been invalidated, and the coin has left its sideways channel. Thus, Ethereum may head toward one of the daily?TF FVGs in the near term, and its dynamics will depend on Bitcoin as before. Among potential POI zones on the 4?hour TF, we can highlight BB and FVG. But buying in a downtrend should be cautious, following short-term strategies.
CHOCH — change of character / break of the trend structure. Liquidity — liquidity, traders' Stop?Losses that market?makers use to build their positions. FVG — Fair Value Gap (area of price inefficiency). Price often moves quickly through such areas, indicating the absence of one side in the market. Later, the price tends to return and react to these zones. IFVG — Inverted Fair Value Gap. After a return to such a zone, the price does not react but impulsively breaks through and then tests it from the other side.
OB — Order Block. A candle on which a market?maker opened a position in order to harvest liquidity and then form their own position in the opposite direction.
Dzięki analizom InstaForex zawsze będziesz na bieżące z trendami rynkowymi! Zarejestruj się w InstaForex i uzyskaj dostęp do jeszcze większej liczby bezpłatnych usług dla zyskownego handlu.


