 Anuluj
Warunki handlowe
Narzędzia


The EUR/USD currency pair continued its upward movement throughout Friday, showing little regard for important macroeconomic reports. On this day, at least four reports were published in the US, two of which are considered significant. As mentioned in other articles, the unemployment rate showed a neutral reading, while the NonFarm Payrolls report was positive. According to fundamental analysis principles, the dollar should have shown growth, if not for one "but." The market has been ignoring nearly all macroeconomic and fundamental events for three months now. Naturally, every time reports like NonFarm Payrolls or the unemployment rate are released, expectations arise for market reactions, but not this time...
Thus, on the hourly timeframe, the upward trend continues to form, with the price located above the Ichimoku indicator lines. The macroeconomic and fundamental backdrop has supported the euro for over a year, while the geopolitical backdrop no longer supports the dollar. In our view, it's clear: the American currency will continue to decline. Whether quickly or slowly does not matter. The important area of 1.1750-1.1760 has been breached for the fourth time. Geopolitics may intermittently spur dollar growth, but that growth is always corrective.
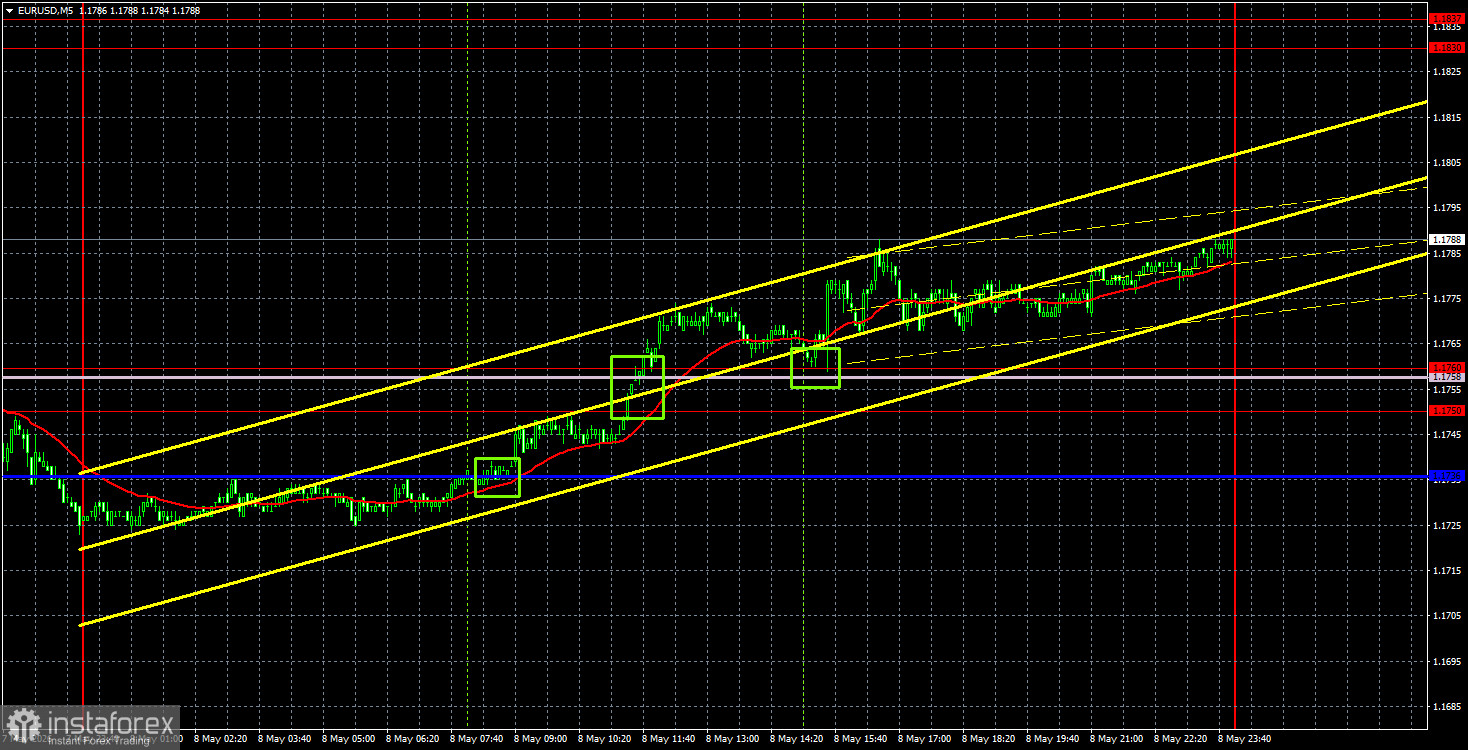
On the 5-minute timeframe, three trading signals were formed on Friday. Initially, the pair crossed the Kijun-sen line, then the area of 1.1750-1.1760 and the Senkou Span B line, and during the American trading session, it rebounded from this indicated area. Thus, traders had at least two opportunities to open long positions. Volatility throughout the day was not high, but it still allowed for a profit of approximately 15-20 pips from the long position.
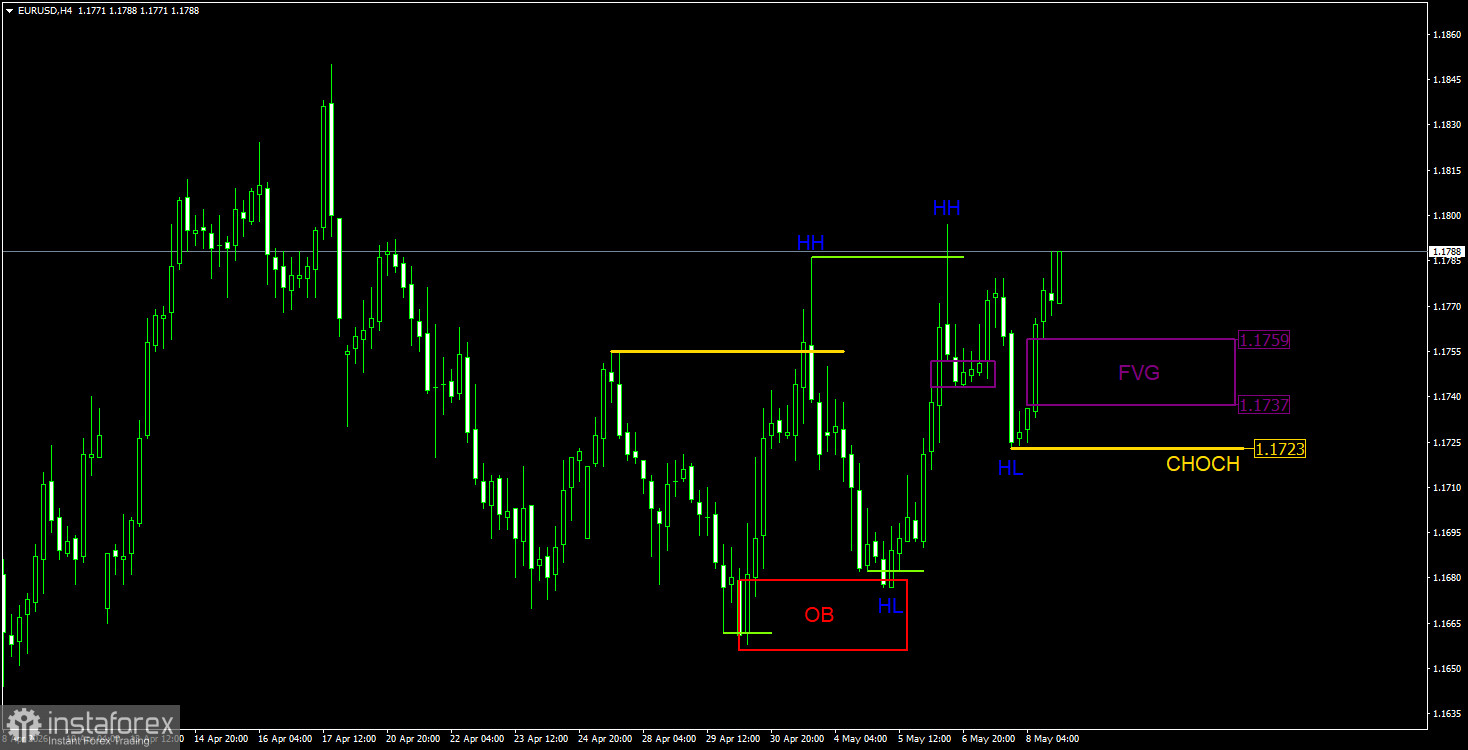
On the 4-hour timeframe, the situation, according to the ICT trading system, is quite clear. There is an upward trend, and the CHOCH line is at 1.1723; only below this level can we consider the upward momentum exhausted. As long as the upward trend persists, we only consider "bullish" patterns, bullish signals, and bullish liquidity removal. Among the recent interesting patterns, we can highlight the bullish FVG in the range of 1.1737-1.1759. This area is of particular interest at the beginning of the week. It is important to note that the presence of an FVG pattern does not guarantee that the price will return to it with 100% certainty in the near future. It may return within the context of the next trend. However, if it is tested on Monday, Tuesday, or Wednesday, a buy signal may be formed. Thus, on the 4-hour timeframe, we anticipate a test of the area 1.1737-1.1759, a break of structure on the M30, and a price reaction.
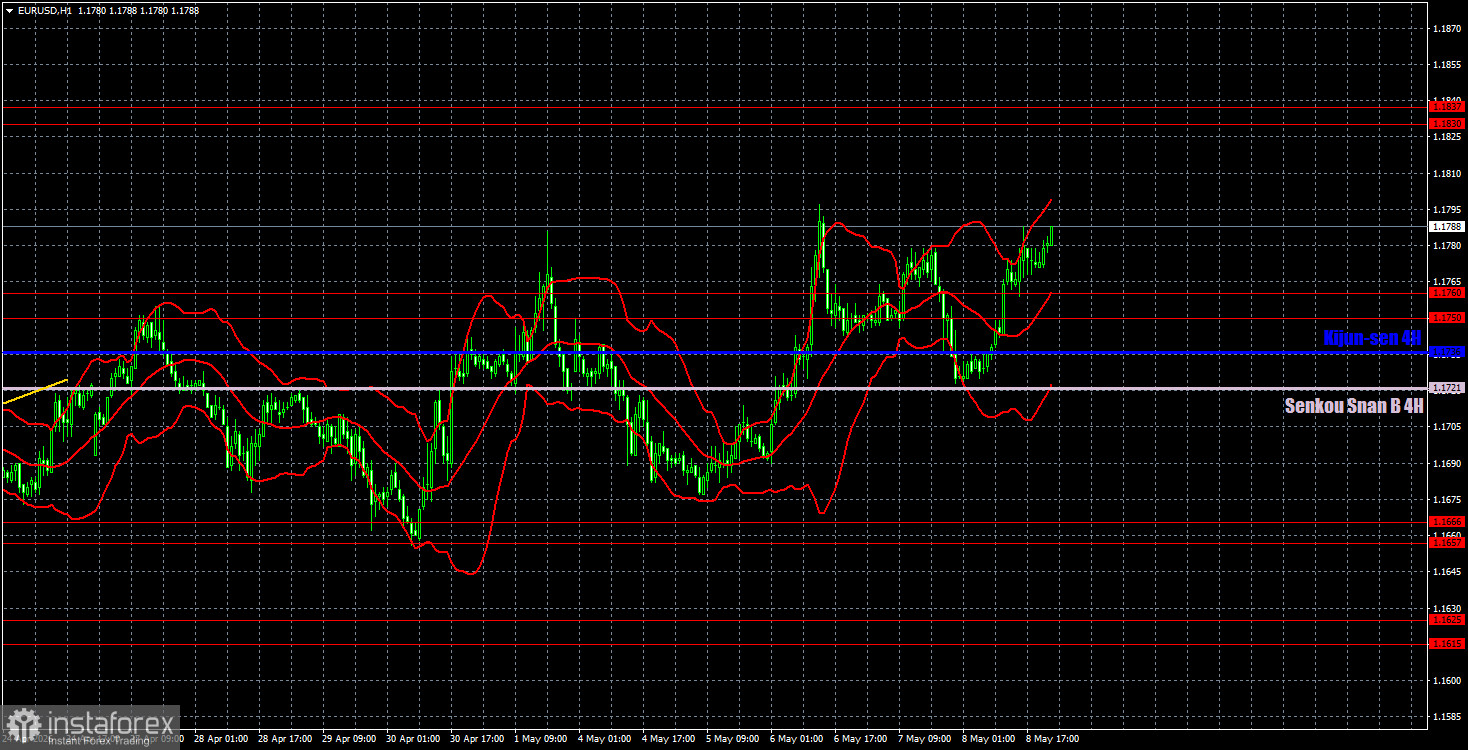
On the hourly timeframe, the EUR/USD pair has begun a new ascent. The situation in the Middle East remains tense but is not worsening, so there is no reason for the US dollar to strengthen further. The dollar had every chance to show growth on Friday, but the market once again ignored significant macroeconomic reports. Only geopolitical factors might hinder further growth.
For May 11, we identify the following trading levels: 1.1362, 1.1426, 1.1542, 1.1615-1.1625, 1.1657-1.1666, 1.1750-1.1760, 1.1830-1.1837, and 1.1907-1.1922, as well as the Senkou Span B line (1.1721) and the Kijun-sen (1.1736). The lines of the Ichimoku indicator may shift throughout the day, which should be accounted for when determining trading signals. Don't forget to set a Stop Loss order to break even if the price moves in the right direction by 15 pips. This will protect against potential losses if the signal turns out to be false.
On Monday, there are no significant events or releases scheduled in the Eurozone, while in the US, a secondary report on home sales will be released. We do not believe that the market will even notice this report. Consequently, during the day, we will see technical (and possibly weak) movements, while only geopolitical factors may influence market sentiment.
Today, traders may consider opening short positions if the price consolidates below the Senkou Span B line, targeting the 1.1657-1.1666 area. Long positions can be maintained after a consolidation above the area of 1.1750-1.1760, targeting 1.1830-1.1837. In a slightly longer-term perspective (after the correction), we should anticipate the formation of a buy signal in the area of 1.1737-1.1759.
Dzięki analizom InstaForex zawsze będziesz na bieżące z trendami rynkowymi! Zarejestruj się w InstaForex i uzyskaj dostęp do jeszcze większej liczby bezpłatnych usług dla zyskownego handlu.


