 Anuluj
Warunki handlowe
Narzędzia


The EUR/USD currency pair continued to trade between a group of levels, areas, and lines. Overall, it is not even worth analyzing which levels were breached and which were not. The sideways movement with a slight upward tilt and low volatility is clearly visible. Over the past three weeks, the euro has been trading against the dollar between the areas of 1.1657-1.1666 and the level of 1.1585. Essentially, the movements we observe daily are market noise rather than a reaction to any events. The macroeconomic backdrop remains largely ignored, and the market is frankly tired of geopolitical issues. For example, yesterday, there was no reaction to the quite important ISM services activity index in the US, nor to Iran's new attacks on Kuwait's international airport. The market is disregarding all events, and volatility remains low.
From a technical perspective, the downward trend persists, as the pair has not been able to initiate an upward movement or breach the 1.1657-1.1666 area over the past three weeks. We are currently witnessing a purely flat movement, the completion of which can be judged either below 1.1585 or above the area of 1.1657-1.1666.
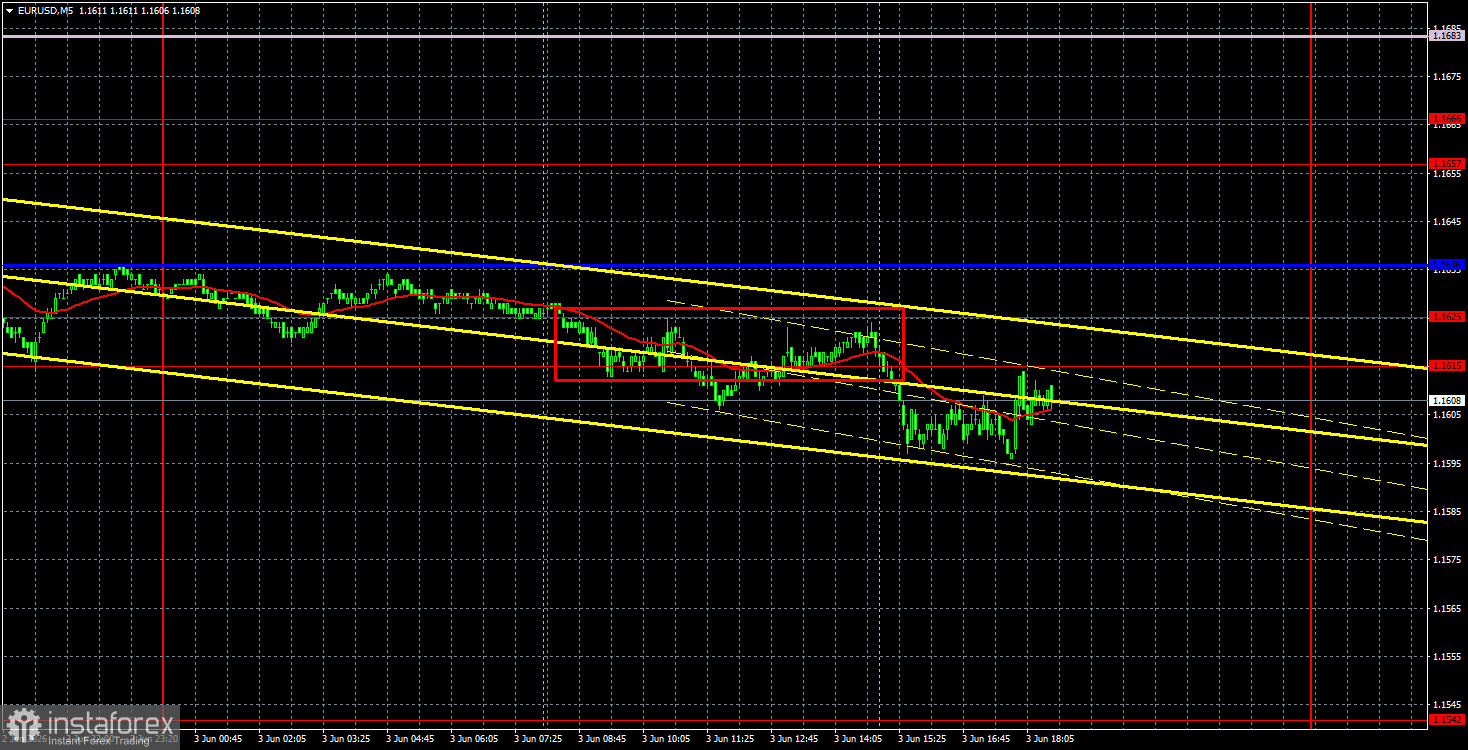
In the 5-minute timeframe on Wednesday, one trading signal was formed, but, as one might guess, it was extremely challenging to realize profits from the trade due to weak movement. Throughout the European trading session, the pair struggled to break through the 1.1615-1.1625 area, but during the American session, it did! By the end of the day, the price dropped by 10 pips...
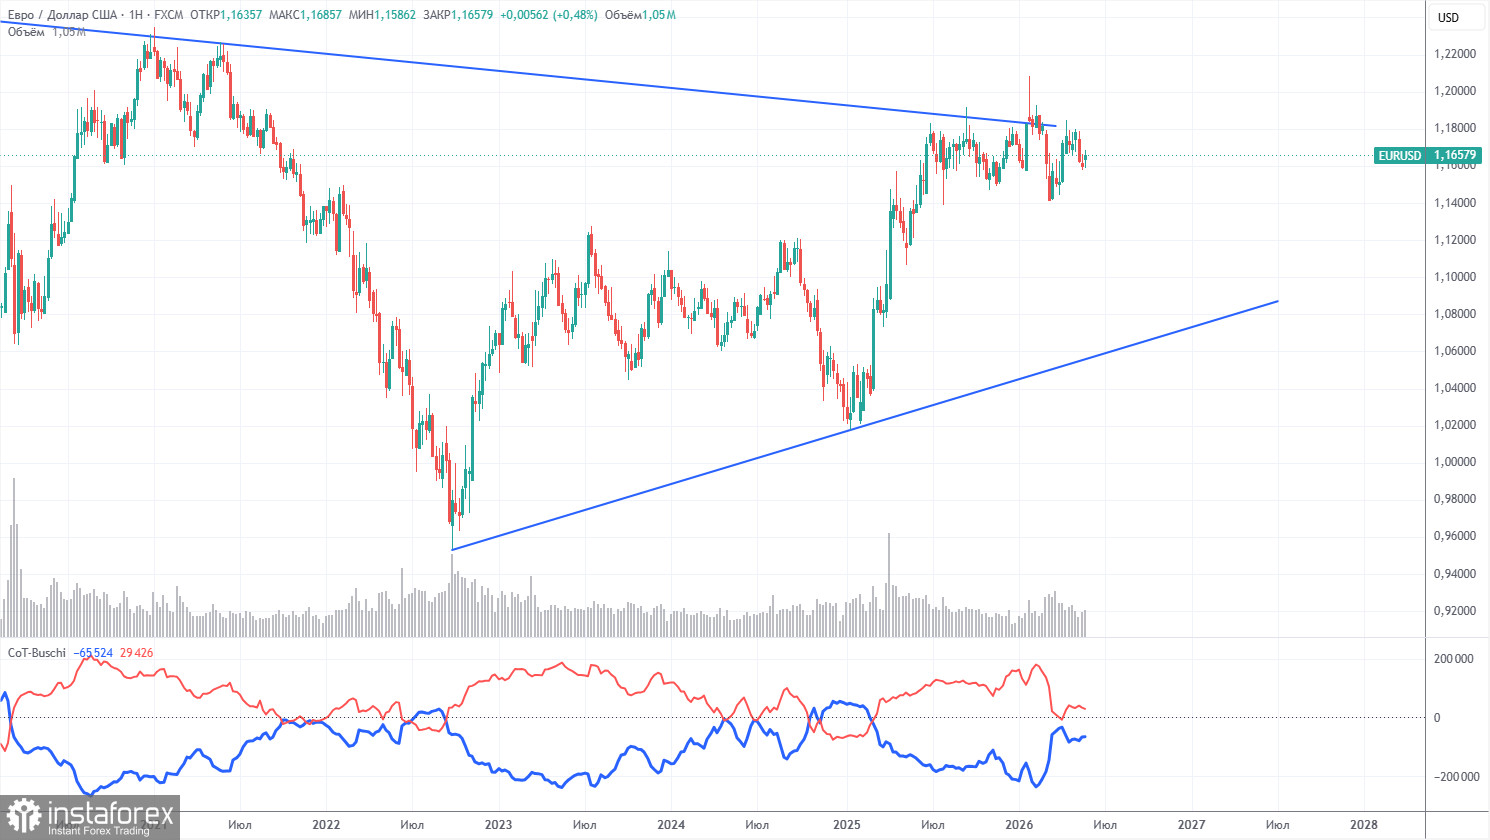
The latest COT report is dated May 26. The weekly timeframe illustration clearly shows that the net position of non-commercial traders remains "bullish," but is rapidly declining due to geopolitical events. Traders have been getting rid of the European currency in favor of the US dollar in recent months. Trump's policies have not changed, but for a time, the dollar acted as a "reserve currency." However, this process may already be complete.
We still do not see any fundamental factors for the strengthening of the euro, while there are sufficient factors for the decline of the dollar. The war in the Middle East made the dollar temporarily super attractive, but once this factor reaches its "expiration date," everything will revert to normal. It may have already expired. In the long term, the euro could fall to the level of $1.06 (the trend line), but the upward trend will still remain relevant. Currently, the pair has not significantly deviated from the descending trend line that has been breached several times.
The positioning of the red and blue lines in the indicator indicates parity between bulls and bears. During the last reporting week, the number of longs in the Non-Commercial group decreased by 10,200, while the number of shorts decreased by 6,100. Consequently, the net position fell by 4,100 contracts over the week.
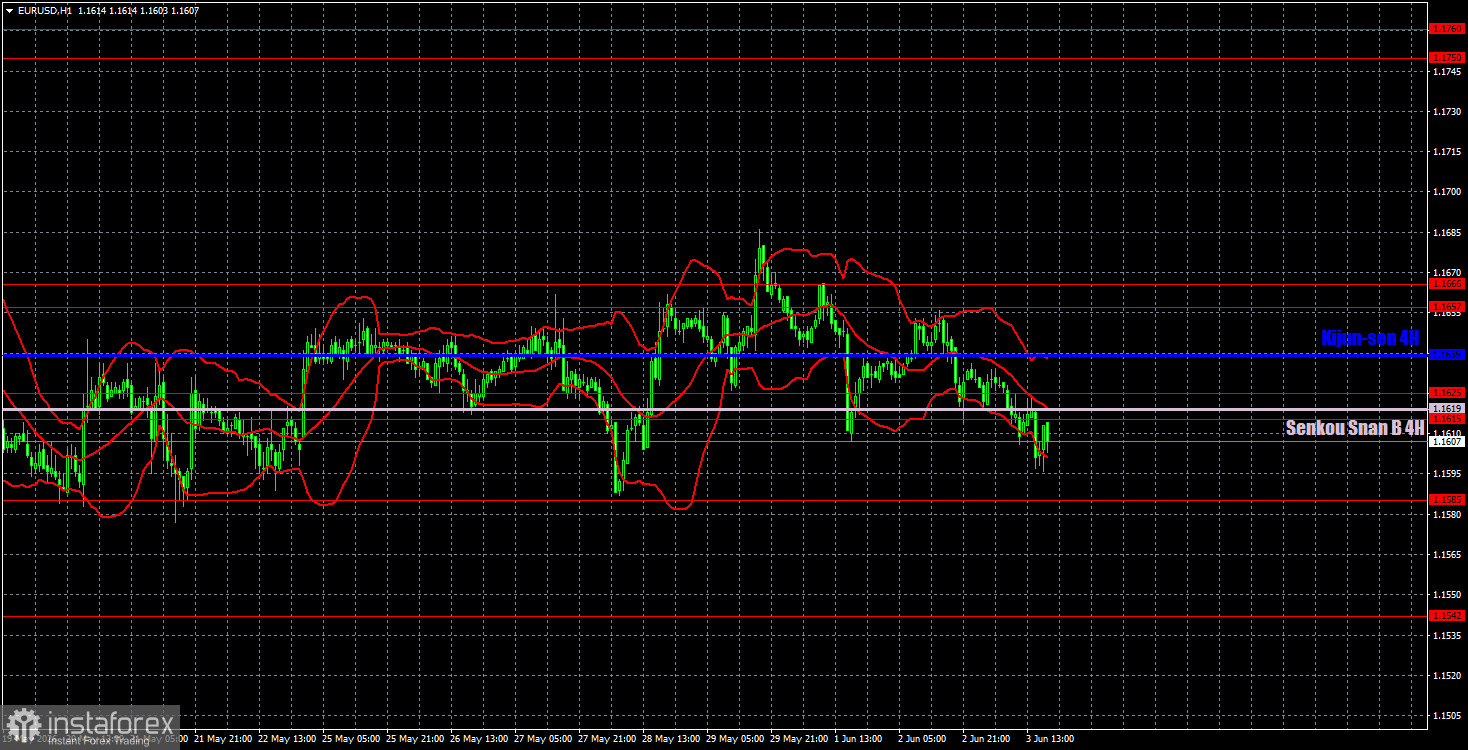
On the hourly timeframe, the EUR/USD pair has been trading in a flat range between the level of 1.1585 and the area of 1.1657-1.1666 for three weeks. The situation in the Middle East remains tense, not worsening, and Washington and Tehran can only dream of signing a preliminary agreement at this point. If no new signs of a resumption of war emerge in the Middle East and the memorandum is indeed signed, the dollar may begin to lose ground. However, so far we have not observed either a deal or a resumption of hostilities.
For June 3, we highlight the following levels for trading: 1.1362, 1.1426, 1.1542, 1.1585, 1.1615-1.1625, 1.1657-1.1666, 1.1750-1.1760, 1.1786, 1.1830-1.1837, 1.1907-1.1922, as well as the Senkou Span B line (1.1619) and Kijun-sen line (1.1639). The Ichimoku indicator lines may shift throughout the day, so this should be taken into account when determining trading signals. Don't forget to set a Stop Loss order to break even if the price moves in the correct direction by 15 pips. This will protect against potential losses if the signal proves false.
On Thursday, the President of the European Central Bank, Christine Lagarde, will give a speech, which could be interesting a week ahead of the central bank's meeting and after the May inflation report, which indicates an acceleration to 3.2%. A retail sales report will also be published. However, we want to remind you that the market is currently ignoring both fundamental and macroeconomic factors equally.
Today, traders may maintain short positions targeting 1.1585 and 1.1542, as the price has consolidated below the 1.1615-1.1625 area. Long positions can be opened in the event of consolidation above the area of 1.1657-1.1666, targeting 1.1750-1.1760.
Dzięki analizom InstaForex zawsze będziesz na bieżące z trendami rynkowymi! Zarejestruj się w InstaForex i uzyskaj dostęp do jeszcze większej liczby bezpłatnych usług dla zyskownego handlu.


