 Anuluj

Warunki handlowe
Narzędzia


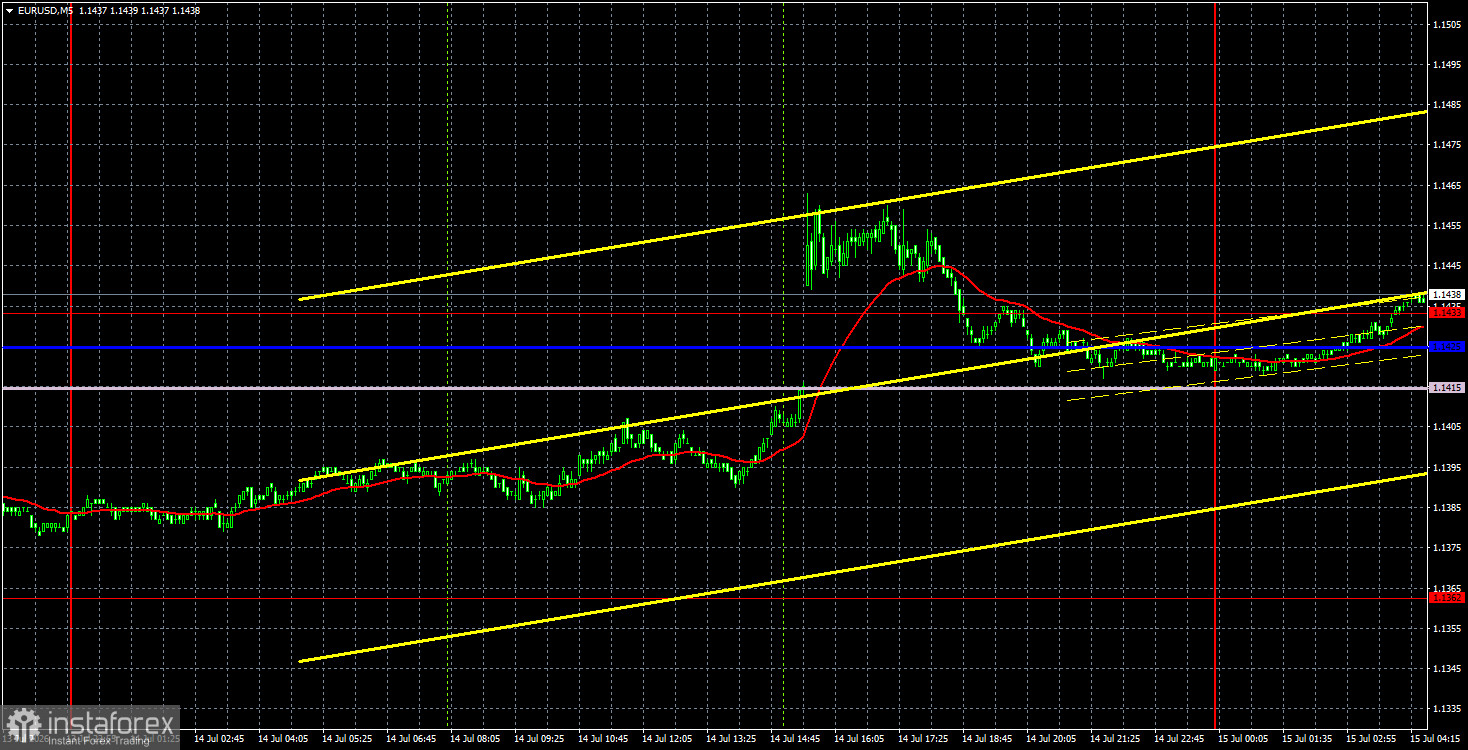
The EUR/USD currency pair continued to trade within a sideways channel on Tuesday, between 1.1362 and 1.1461. Thus, we have been dealing with a flat for over two weeks. With the market in a flat, low volatility can be easily explained. Even yesterday, when a significant inflation report was released in the U.S., along with Kevin Warsh's speech in Congress, the technical picture did not change. Yes, immediately after the Consumer Price Index was released, the price spiked sharply upward, but by the end of the day, it returned to its original level. Therefore, the inflation report had no impact on the trend. The same can be said for Warsh's speech, which many traders awaited with great anticipation. As for the inflation figure, it was below economists' forecasts, which somewhat reduces the likelihood of a tightening of the Federal Reserve's monetary policy by the end of the year. However, we must remember that the conflict in the Middle East has resumed, so inflation could once again accelerate by the end of June.
From a technical perspective, a new downward trend may begin soon. The ascending trend line has been breached, the Ichimoku indicator lines have been surpassed, and the euro has failed to show any substantial growth over the past two weeks. However, in recent weeks, the pair has been moving more sideways than upward or downward, hence the current flat status.
On the 5-minute timeframe, no trading signals were generated on Tuesday. At the beginning of the U.S. trading session, when the inflation report was published, the price spiked upward sharply, but there was no opportunity to react to this rise. As a result, traders had no basis to enter the market.
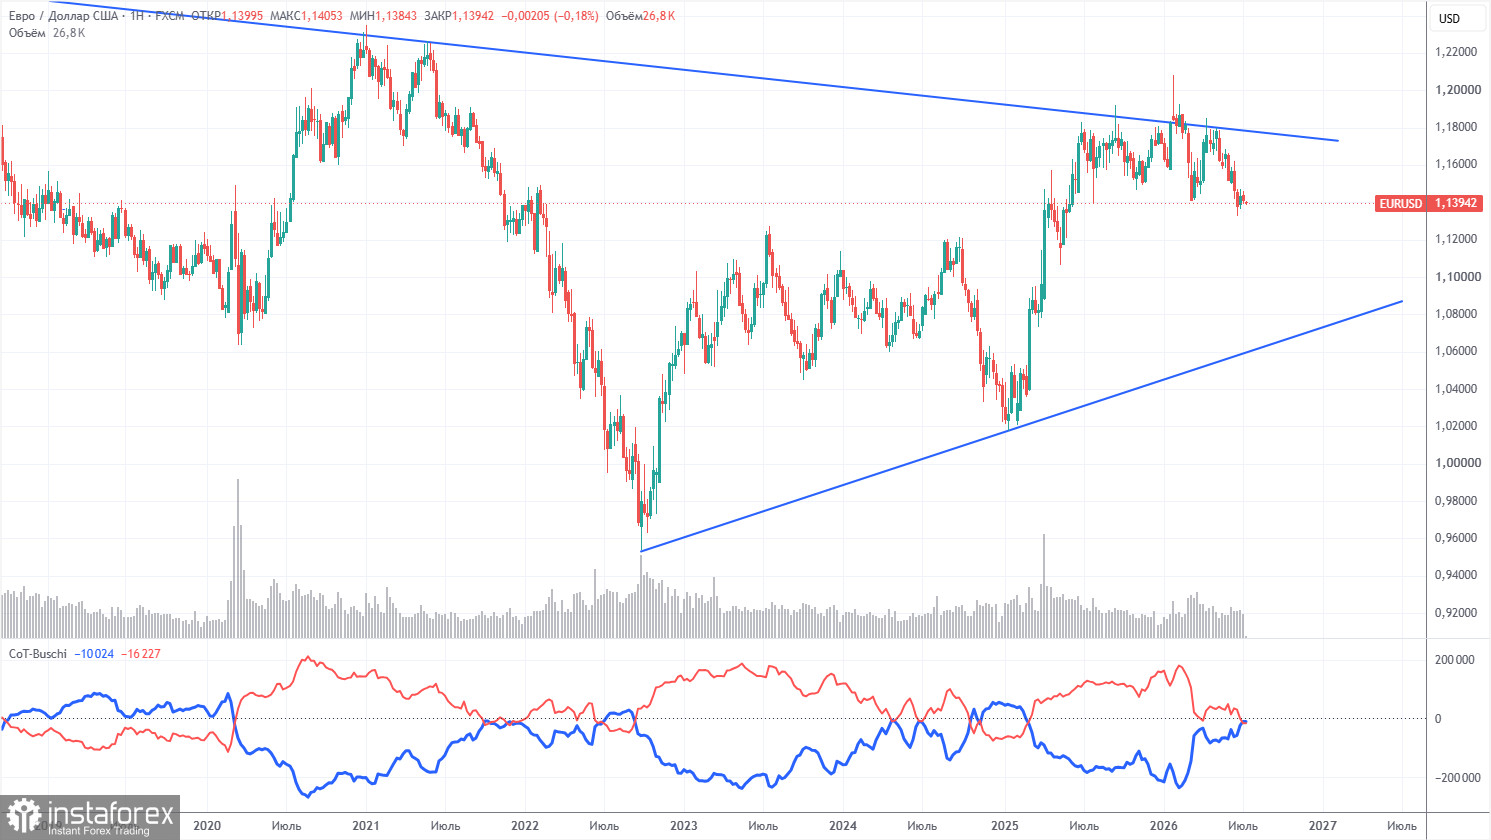
The latest COT report is dated July 7. The illustration on the weekly timeframe clearly shows that the net position of non-commercial traders remains bullish, but has significantly decreased due to geopolitical events. Traders have been shedding the European currency in favor of the U.S. dollar in recent months. Donald Trump's policies have not changed, but the dollar has acted as a "reserve currency" for some time. However, this process may have already come to an end.
We still do not see any fundamental factors for strengthening the European currency, while there are enough factors for the U.S. dollar to decline. The war in the Middle East made the dollar temporarily super attractive, but when this factor reaches its "expiration date," everything will return to normal. And that may have already occurred. In the long term, the euro could decline to the level of $1.08 (the trend line), but the upward trend will still remain relevant. Moreover, in the recent months of dollar growth, the pair has not come significantly closer to this line.
The position of the red and blue lines of the indicator indicates parity between bulls and bears. During the last reporting week, the number of longs in the "Non-commercial" group decreased by 12,200, while the number of shorts increased by 5,100. Consequently, the net position fell by 17,300 contracts over the week.
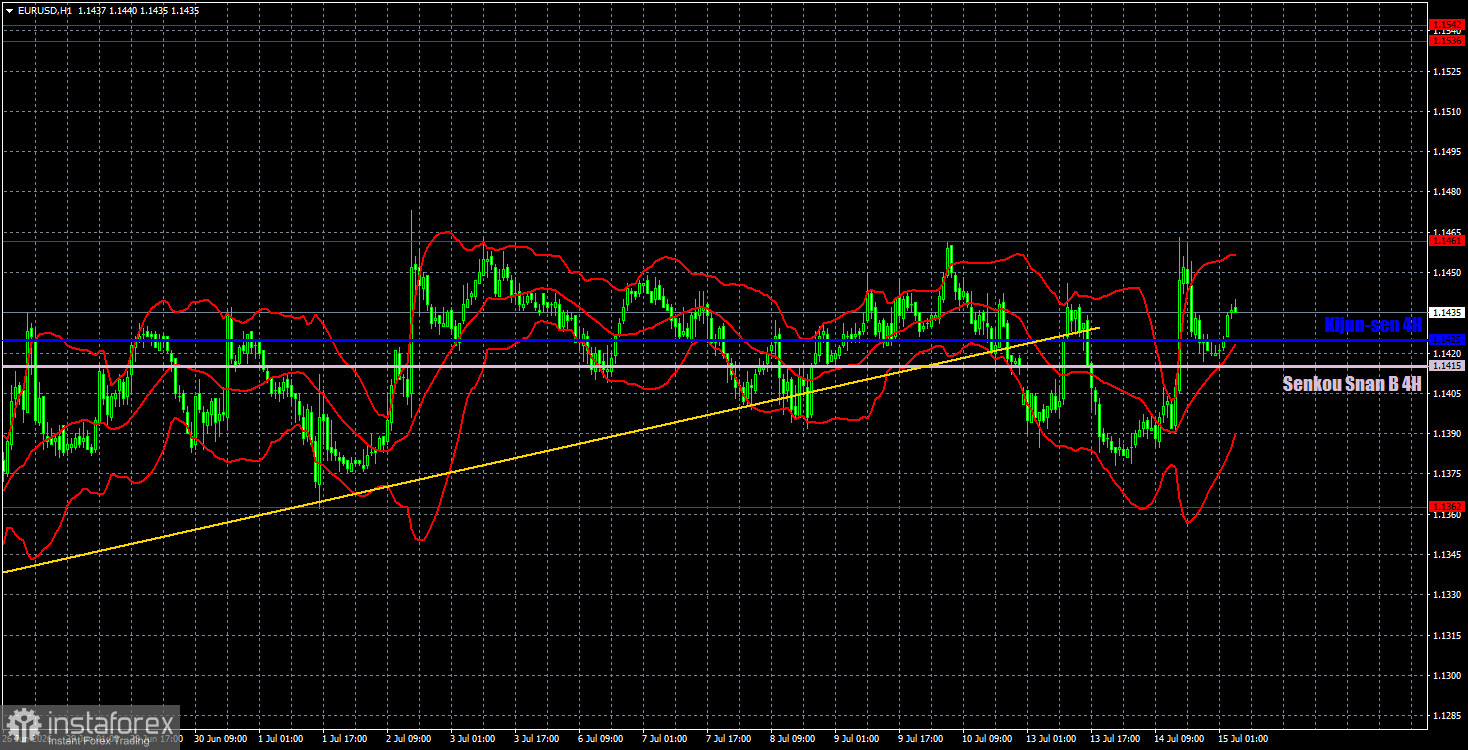
On the hourly timeframe, a corrective upward trend continues to form within a two-month downward trend, but the pair has traded exclusively between 1.1362 and 1.1461 over the past two weeks. The situation in the Middle East remains tense and is not improving. The market continues to ignore many factors in favor of the euro, so the euro is closer to a new decline than to growth.
For July 15, we highlight the following trading levels: 1.1234, 1.1274, 1.1362, 1.1461, 1.1536-1.1542, 1.1585, 1.1657-1.1666, 1.1750-1.1760, 1.1786, 1.1830-1.1837, as well as the Senkou Span B line (1.1415) and Kijun-sen (1.1425). The lines of the Ichimoku indicator may shift during the day, which should be taken into account when determining trading signals. Don't forget to set Stop Loss orders to breakeven if the price moves in the right direction by 15 pips. This will protect against potential losses if the signal proves false.
On Wednesday, Warsh will make his second appearance in the U.S. Congress; however, if the first appearance did not provoke any market reaction, it is unlikely that the second will either. Additionally, the producer price index will be released in the U.S. today, which holds little value considering yesterday's inflation report, while in Europe, industrial production data will be published.
Today, traders may consider short positions targeting 1.1415 and 1.1362 if the price bounces from 1.1461. Long positions can be opened with targets of 1.1536-1.1542 if the price consolidates above 1.1461, the upper boundary of the sideways channel. The volatility of the pair remains weak.
Dzięki analizom InstaForex zawsze będziesz na bieżące z trendami rynkowymi! Zarejestruj się w InstaForex i uzyskaj dostęp do jeszcze większej liczby bezpłatnych usług dla zyskownego handlu.


