 Anuluj

Warunki handlowe
Narzędzia


On Wednesday, the EUR/USD currency pair moved in a way that was completely different from what most traders expected. However, with effort, those moves can be explained. The main problem on Wednesday was some ambiguity in the US inflation report. On the one hand, it is an important indicator that determines the fate of Federal Reserve monetary policy. On the other hand, its July value matched forecasts. On the one hand, US inflation slowed, reducing the probability of a Fed rate hike in September; on the other hand, the slowdown was only 0.1%, and inflation may accelerate again in August. In short, the market could not draw a clear conclusion about what inflation at 3.4% means. It remains elevated, but given the current state of the US labor market, it is not certain that the Fed will raise the key rate. By the end of the day, the dollar neither rose nor fell clearly. The uptrend persists, but the pair is currently showing very low volatility, and market participants are unwilling to trade.
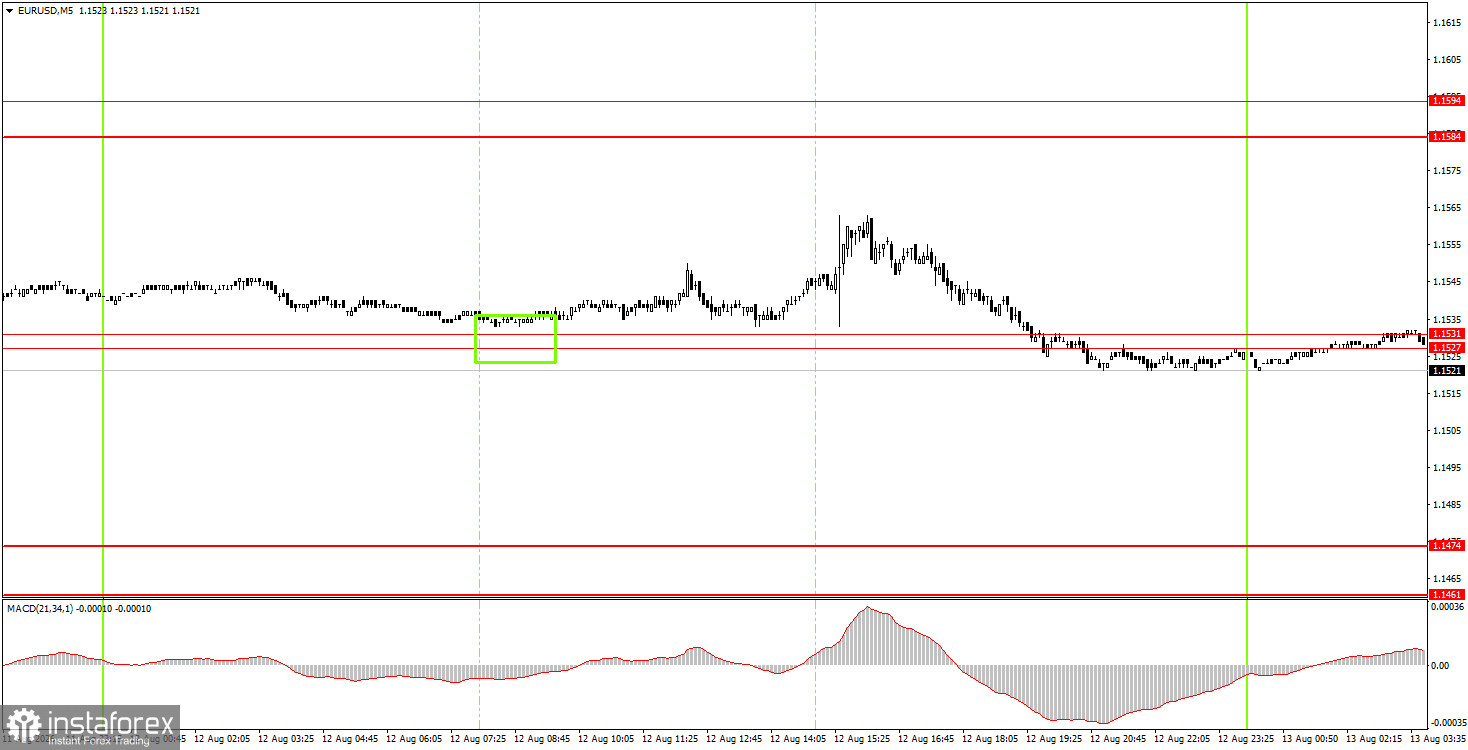
On the 5-minute TF on Wednesday, one trading signal was formed. During the European session, the price bounced with minimal deviation from the 1.1527–1.1531 area, rising by 25 pips but failing to reach the nearest target, and overall volatility remained weak. By the end of the day, quotes returned to the 1.1527–1.1531 area.
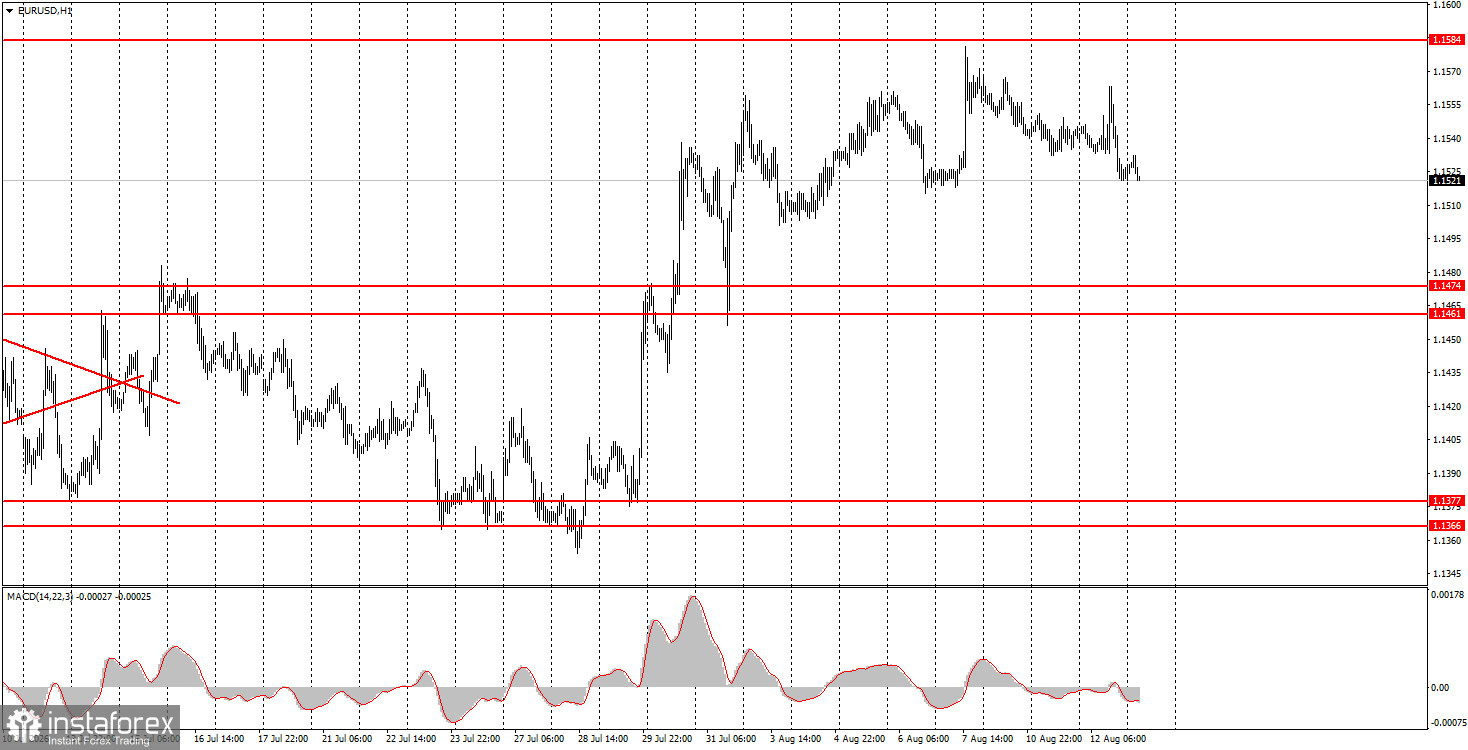
On the hourly timeframe, the price left the sideways channel it spent a month in and continues to form an upward trend. Taking into account all events of recent months, we believe the euro should continue to rise confidently. In recent months, the market has consistently ignored many factors in favor of the euro, so we continue to expect further gains for the euro. However, over the past week, volatility has fallen, and the market shows no desire to continue buying the euro.
On Thursday, novice traders can open short positions with a target of 1.1461–1.1474 if the price consolidates below the 1.1527–1.1531 area. Buy trades can be opened in case of a new rebound from the 1.1527–1.1531 area, with a target of 1.1584–1.1594.
On the 5-minute TF, consider levels 1.1267–1.1275, 1.1366–1.1377, 1.1461–1.1474, 1.1527–1.1531, 1.1584–1.1594, 1.1655–1.1666, 1.1745–1.1754. On Thursday, the EU will publish industrial production data, and the US will release the producer price index. We do not consider either report important, and volatility remains weak, indicating the market's current reluctance to trade actively.
Support and resistance price levels (areas) are the targets when opening buy or sell orders or sources of signals.
Red lines denote channels or trend lines that reflect the current trend and indicate in which direction trading is currently favored.
The MACD indicator (14,22,3) – histogram and signal line – is a supporting indicator that can also be used as a source of signals.
Important speeches and reports (as listed in the news calendar) can significantly influence the movement of the currency pair. Therefore, during their release, trading should be approached with utmost caution, or one should exit the market to avoid sharp price reversals against the preceding movement.
Beginners in Forex trading should remember that not every trade can be profitable. Developing a clear strategy and proper money management are essential for long-term trading success.
Dzięki analizom InstaForex zawsze będziesz na bieżące z trendami rynkowymi! Zarejestruj się w InstaForex i uzyskaj dostęp do jeszcze większej liczby bezpłatnych usług dla zyskownego handlu.


