 Anuluj

Warunki handlowe
Narzędzia


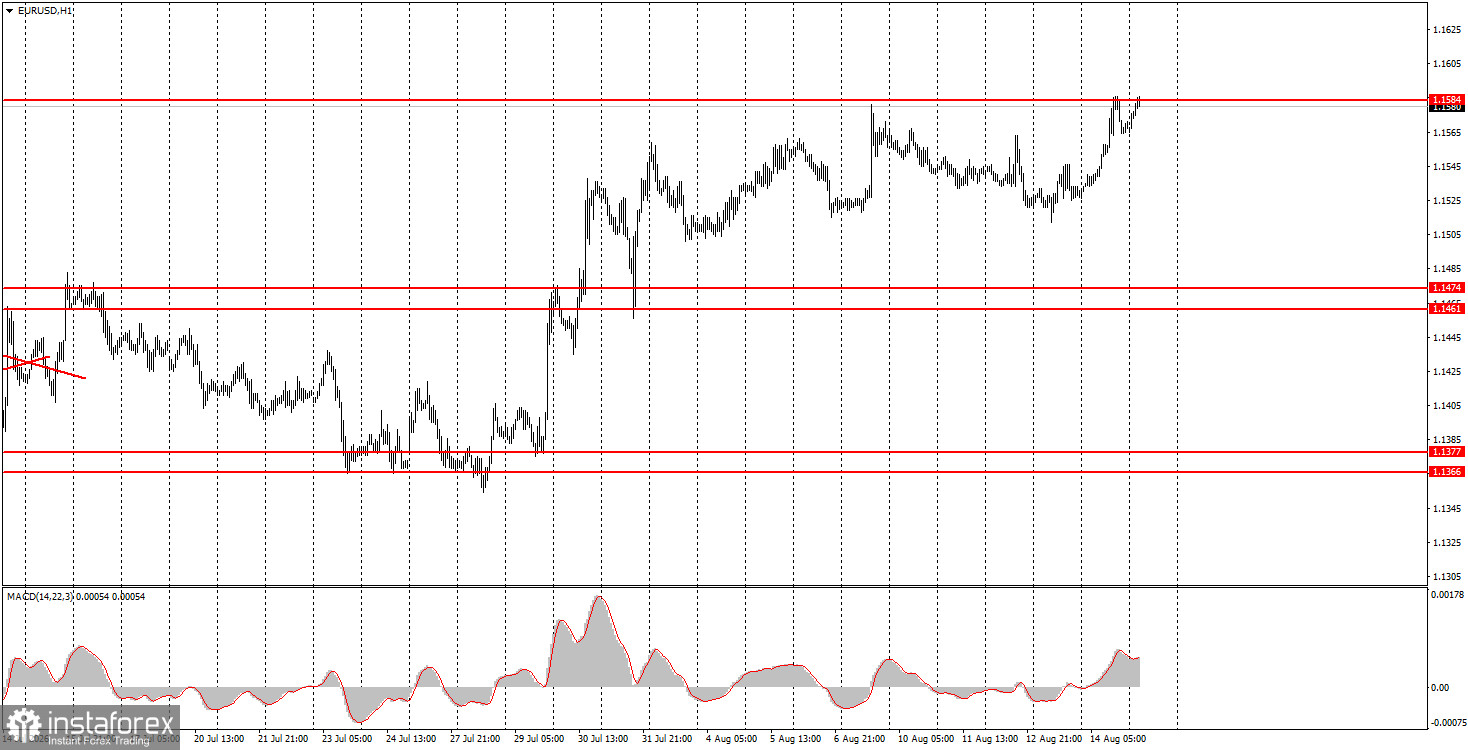
The EUR/USD currency pair returned to 1.1584 on Friday and, overall, retains an upward trend. We have repeatedly listed a whole range of factors supporting the euro and acting against the dollar. Therefore, even without local grounds, the European currency can continue its upward movement. However, there were indeed reasons on Friday. The GDP report for the Eurozone in the second quarter received little market attention, but it proved bland, with both quarterly and annual figures matching forecasts. On the other hand, both American reports supported buyers, showing values well below expected levels. Retail sales in July decreased by 0.6% versus forecasts of +0.1%, while the University of Michigan consumer sentiment index was 51 in August, though the market expected 54.5. Thus, the dollar continues to decline, albeit slowly. In our view, the decline of the American currency will continue.
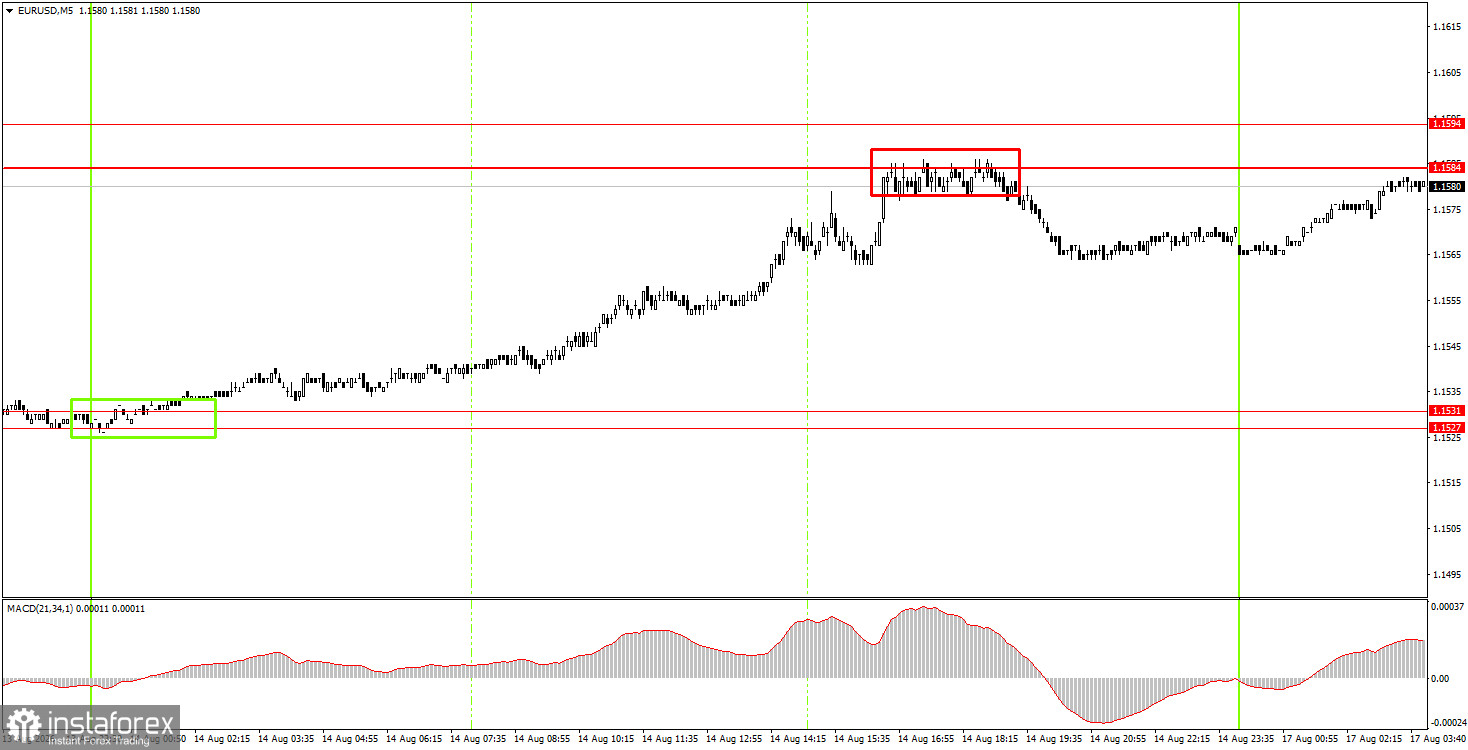
On the 5-minute timeframe, two trading signals were generated on Friday. During the Asian trading session, the price rebounded from the 1.1527-1.1531 area. Still, at the opening of the European trading session, it had not strayed far from the signal formation point, so traders could safely open long positions. During the American session, prices bounced from the area of 1.1584-1.1594, but it was unlikely that new positions should be opened before the market closed for the weekend. Long positions yielded about 35 pips in profit.
On the hourly timeframe, the EUR/USD pair continues to form an upward trend. Considering all the events of recent months, we believe that the European currency should continue to rise confidently. In recent months, the market has stubbornly ignored many factors in favor of the euro, so we continue to expect further gains for the euro.
On Monday, novice traders may open short positions with targets of 1.1527-1.1531 if the price rebounds from the 1.1584-1.1594 area. Long positions can be opened if the price breaks through the 1.1584-1.1594 area, with targets at 1.1655-1.1666.
On the 5-minute timeframe, consider the levels 1.1267-1.1275, 1.1366-1.1377, 1.1461-1.1474, 1.1527-1.1531, 1.1584-1.1594, 1.1655-1.1666, and 1.1745-1.1754. On Monday, there are no significant events or publications scheduled in the Eurozone or the US, so we can expect a "boring Monday." Volatility has been low in recent weeks and is likely to remain low today as well.
Support and resistance price levels (areas) are the targets when opening buy or sell orders or sources of signals.
Red lines denote channels or trend lines that reflect the current trend and indicate in which direction trading is currently favored.
The MACD indicator (14,22,3) – histogram and signal line – is a supporting indicator that can also be used as a source of signals.
Important speeches and reports (as listed in the news calendar) can significantly influence the movement of the currency pair. Therefore, during their release, trading should be approached with utmost caution, or one should exit the market to avoid sharp price reversals against the preceding movement.
Beginners in Forex trading should remember that not every trade can be profitable. Developing a clear strategy and proper money management are essential for long-term trading success.
Dzięki analizom InstaForex zawsze będziesz na bieżące z trendami rynkowymi! Zarejestruj się w InstaForex i uzyskaj dostęp do jeszcze większej liczby bezpłatnych usług dla zyskownego handlu.


