 Anuluj

Warunki handlowe
Narzędzia


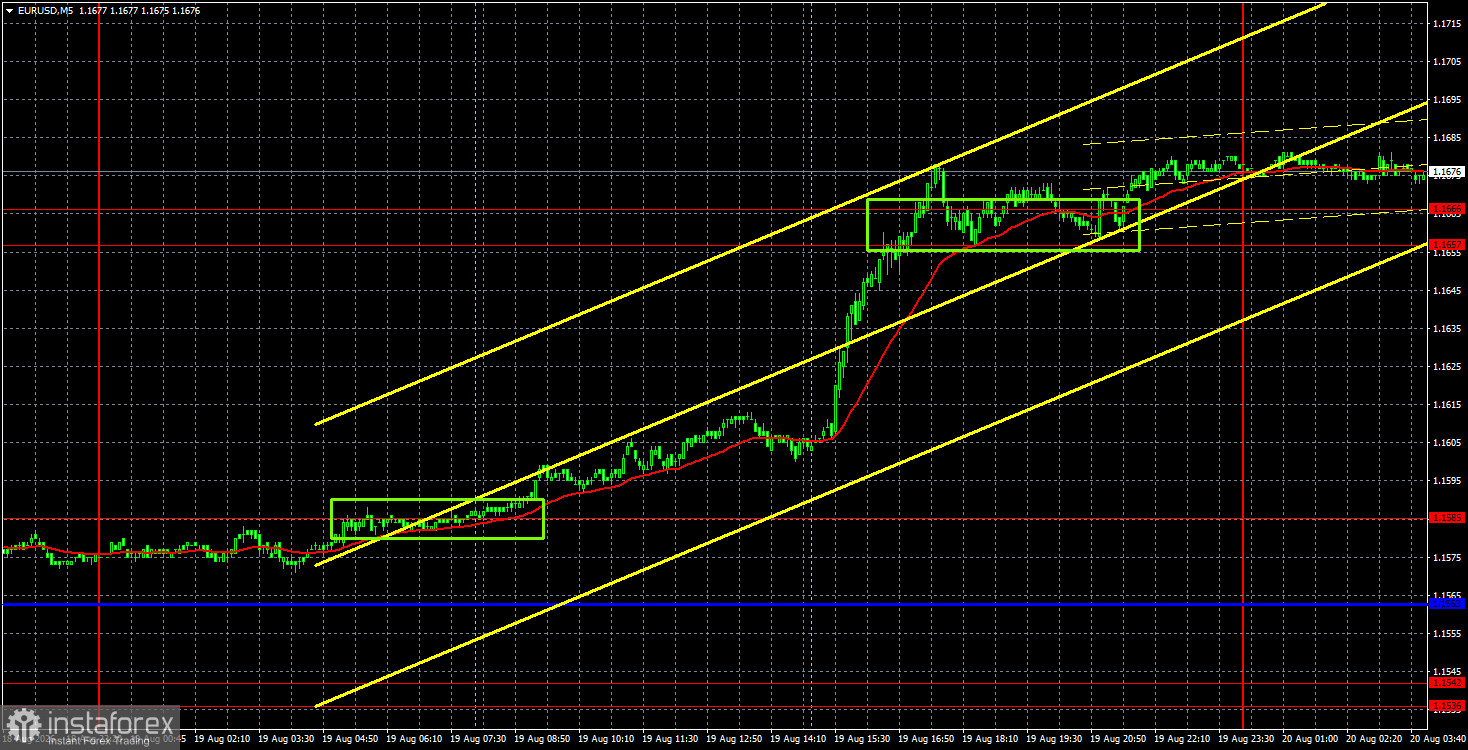
The EUR/USD currency pair unexpectedly showed strong upward movement and fairly good volatility on Wednesday, which we haven't seen in a couple of weeks. Most traders immediately rushed to find reasons for the euro's rise and the dollar's decline. In our view, there are no specific reasons. It is better to say that the reason is the decline in demand for the American currency, but this is not a specific fundamental or macroeconomic event that could be anticipated or forecast. The European currency has not "increased"; it is "continuing to rise" based on a combination of factors and the technical picture. The movement is stable and trending. For such movement, local reasons and support are not always necessary.
The EUR/USD pair has been in a sideways channel for an entire year, as clearly seen on the weekly timeframe. In addition, there is a long-term upward trend that began in 2022. Besides the geopolitical factor, the dollar has no other growth drivers. Everything the dollar managed to show in the past year has been a minor correction. Thus, the conclusion was obvious a couple of months ago: the dollar will resume its decline in any case. This is what we are currently observing. Geopolitics has merely delayed the next devaluation of the American currency.
From a technical standpoint, the pair continues to form an upward trend. While the trend is not too strong, it is worth noting that none of the global factors currently favor the U.S. currency. Only geopolitics can help it, specifically some major event, rather than just another exchange of threats and pleasantries between Iran and the U.S.
On the 5-minute timeframe, two buy signals were formed on Wednesday. At the very beginning of the European trading session, the price broke above 1.1585, allowing traders to open long positions. By the end of the day, the pair broke through the area of 1.1657-1.1666, allowing long positions to remain open. However, traders could also calmly take profits on their trades.
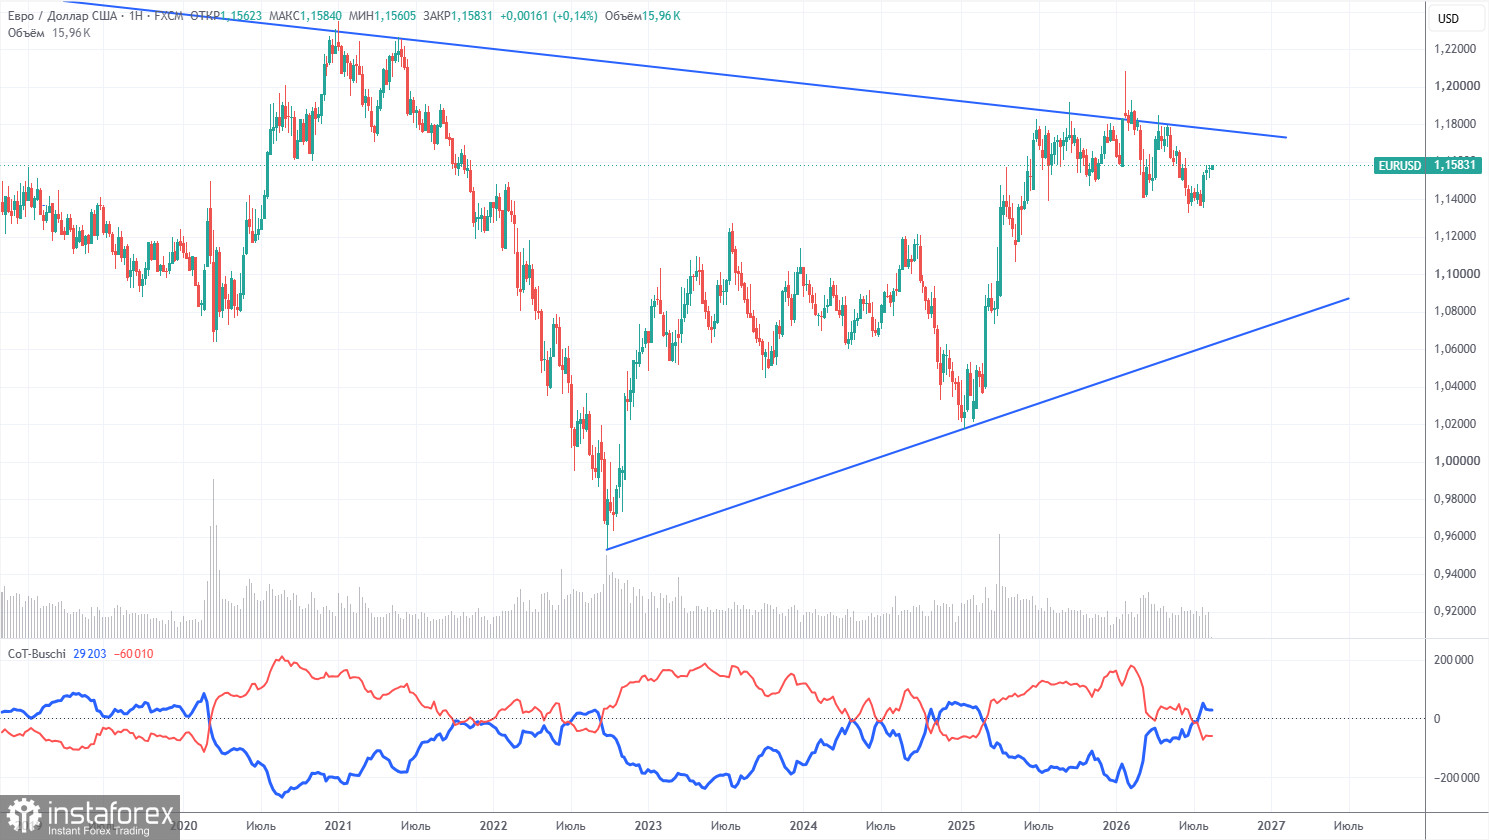
The latest COT report is dated August 11. The weekly timeframe illustration clearly shows that the net position of non-commercial traders has become "bearish" and has significantly declined in 2026 due to geopolitical events. Traders have been shedding European currency in favor of the U.S. dollar in recent months. Donald Trump's policies have not changed, but for a time, the dollar acted as a "reserve currency."
We still do not see any fundamental factors for strengthening the European currency, while there are still enough reasons for the U.S. dollar to decline. The war in the Middle East made the dollar temporarily super attractive, but when this factor reaches its "expiry date," everything will return to normal. This process may have already concluded. In the long term, the euro could fall to the level of $1.08 (the trend line), but the upward trend will still remain relevant. Over the past months of dollar strength, the pair has not come anywhere near this line.
The positioning of the red and blue lines of the indicator indicates parity between bulls and bears. During the last reporting week, the number of long positions in the "Non-commercial" group decreased by 4,600, while the number of short positions decreased by 2,700. Accordingly, the net position decreased by 1,900 contracts over the week.
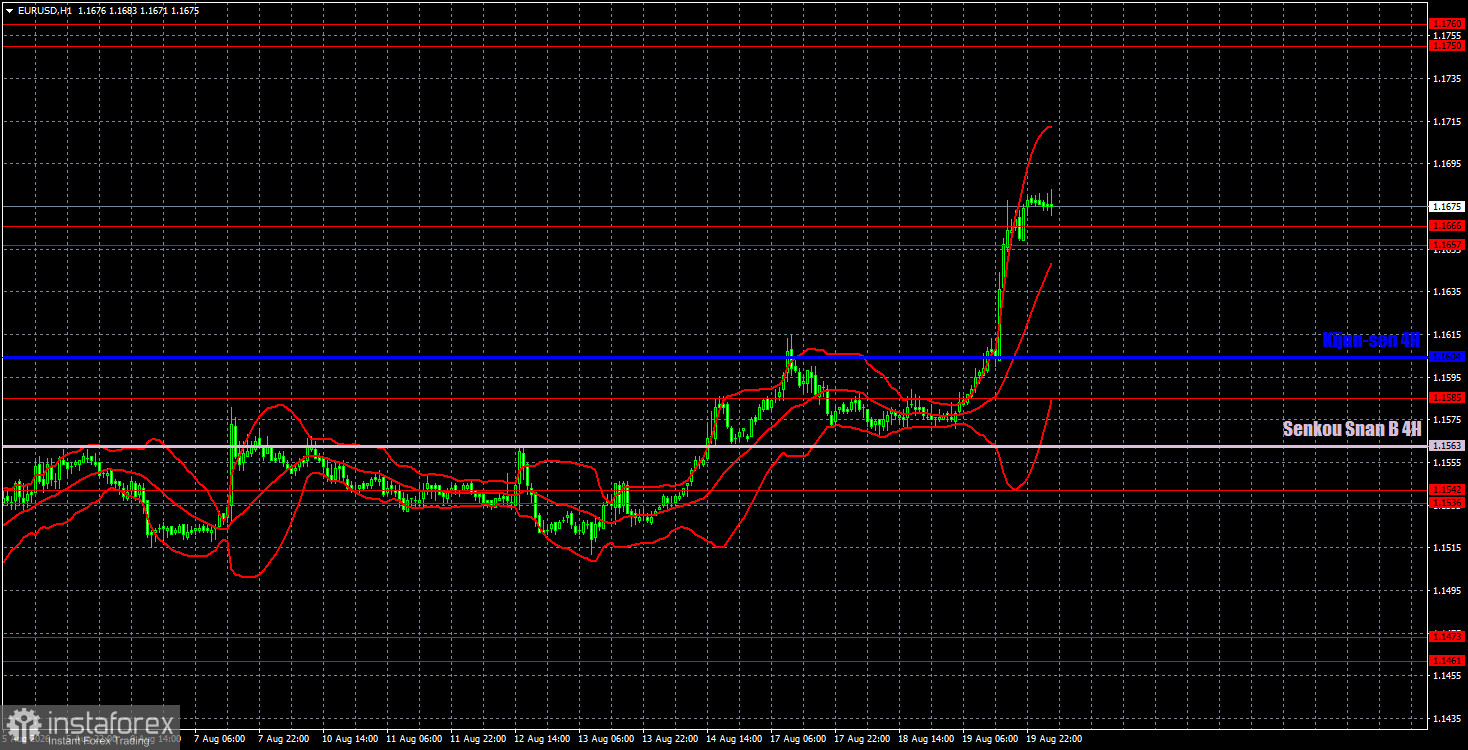
On the hourly timeframe, the pair maintains an upward trend. The situation in the Middle East remains tense and has not improved, but this is not enough for a new, powerful rise of the dollar. Over the past few months, the market has ignored all positive factors for the euro and focused solely on the Federal Reserve's monetary policy, placing inflated demands on it. Currently, the European currency has every chance for medium-term growth, while the dollar can only rely on technical corrections and geopolitics.
For August 20, we identify the following levels for trading: 1.1234, 1.1274, 1.1362-1.1368, 1.1461-1.1473, 1.1536-1.1542, 1.1585, 1.1657-1.1665, 1.1750-1.1760, 1.1786, 1.1830-1.1837, as well as the Senkou Span B line (1.1563) and the Kijun-sen line (1.1604). The Ichimoku indicator lines may shift throughout the day, which should be taken into account when determining trading signals. Don't forget to set stop-loss orders to break even if the price moves in the right direction by 15 pips. This safeguards against potential losses if the signal proves false.
On Thursday, no important reports or events are scheduled in either the Eurozone or the U.S. However, the euro may continue to rise throughout the day. Today, trading should be based on technical factors.
Today, traders may consider short positions targeting 1.1604 and 1.1585 if the price settles below the 1.1657-1.1665 range. A consolidation above the range of 1.1657-1.1665 allows for maintaining long positions with the next target around 1.1750-1.1760.
Dzięki analizom InstaForex zawsze będziesz na bieżące z trendami rynkowymi! Zarejestruj się w InstaForex i uzyskaj dostęp do jeszcze większej liczby bezpłatnych usług dla zyskownego handlu.


