 Anuluj

Warunki handlowe
Narzędzia


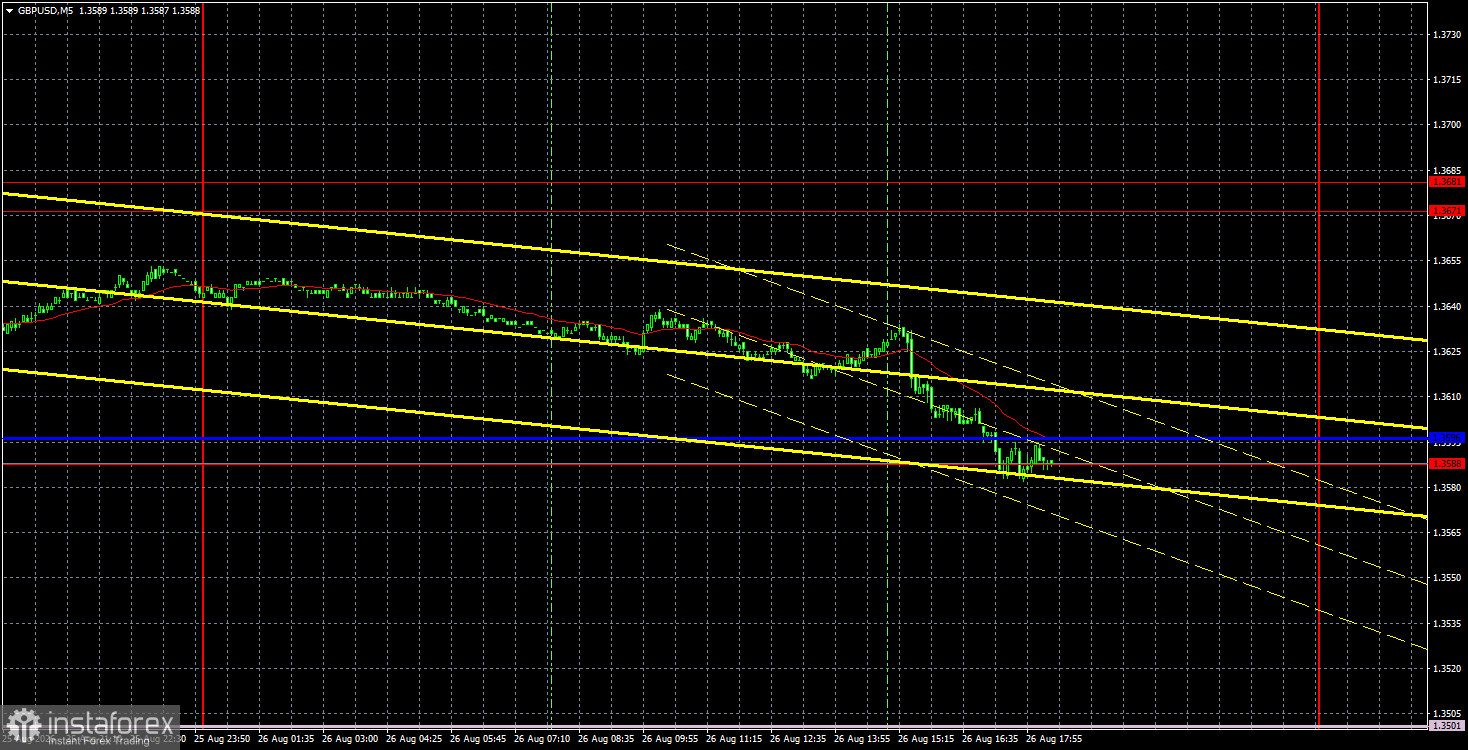
The GBP/USD currency pair continued to correct on Wednesday after bouncing off the 1.3671-1.3681 area. For several days, the price remained stagnant, but on Wednesday, under pressure from somewhat ambiguous overseas macroeconomic data, it fell almost to the Senkou Span B line. Currently, the price remains above the Senkou Span B line and the trendline, indicating that the upward trend is sustained. The only event yesterday that could have strengthened the dollar was the U.S. durable goods orders report. It was better than forecasts, which might have triggered a rise in the American currency. There were no other reasons. The more important GDP report, the second estimate, matched the initial estimate. Thus, we believe the British pound will continue to rise. Above the trendlines and Senkou Span B, discussions of a prolonged decline in the pair are not on the table. If the trendline is breached, then the correction could take on a more extended nature.
The most important day this week is Friday, when Kevin Warsh will speak in Jackson Hole, and the annual Non-Farm Payroll data will be released.
From a technical perspective, the British pound continues to form an upward trend on the hourly timeframe, as indicated by the trendline. In the long-term view, the pair remains in a sideways channel and may resume the global upward trend of 2022. A liquidity withdrawal occurred near the last daily high, so the price may correct slightly downward.
On the 5-minute timeframe, no trading signals were generated on Wednesday; however, traders could still have held short positions after the price bounced from the 1.3671-1.3681 area last Friday. Ultimately, the price reached the nearest target – 1.3588.
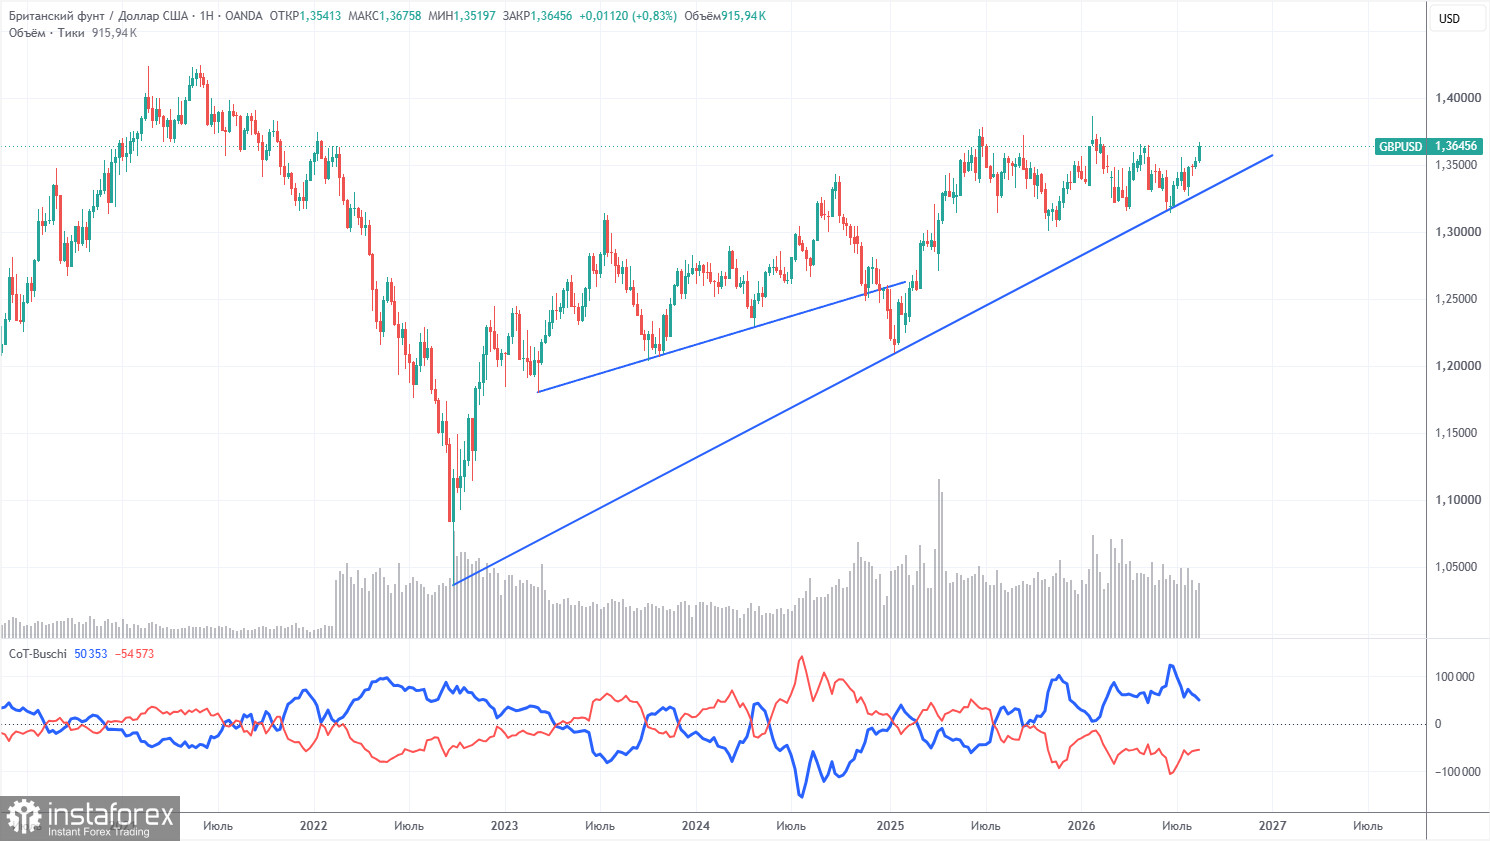
COT reports for the British pound show that non-commercial traders have dominated the market with sales for several consecutive months. The net position remains negative, despite the ongoing upward trend in the long term. Given the events in the Middle East, it is not surprising that demand for the dollar was quite high in the first half of 2026. The war is formally over, but the conflict persists. Only geopolitics can support the U.S. dollar in the near term. However, without a break below the trendline, we would not expect significant declines in the pair.
In the long run, the dollar will continue to decline due to Trump's policies, as is clearly visible on the weekly timeframe. The trade war will continue in one form or another for a long time, and Trump's policies are aimed directly and indirectly at weakening the American currency. The long-term upward trend remains intact, as indicated by the trendline. The price recently reacted to this line and bounced off it. According to the latest COT report (dated August 18), the "Non-commercial" group opened 12,100 BUY contracts and 10,400 SELL contracts. Therefore, the net position of non-commercial traders has increased by 1,700 contracts over the week.
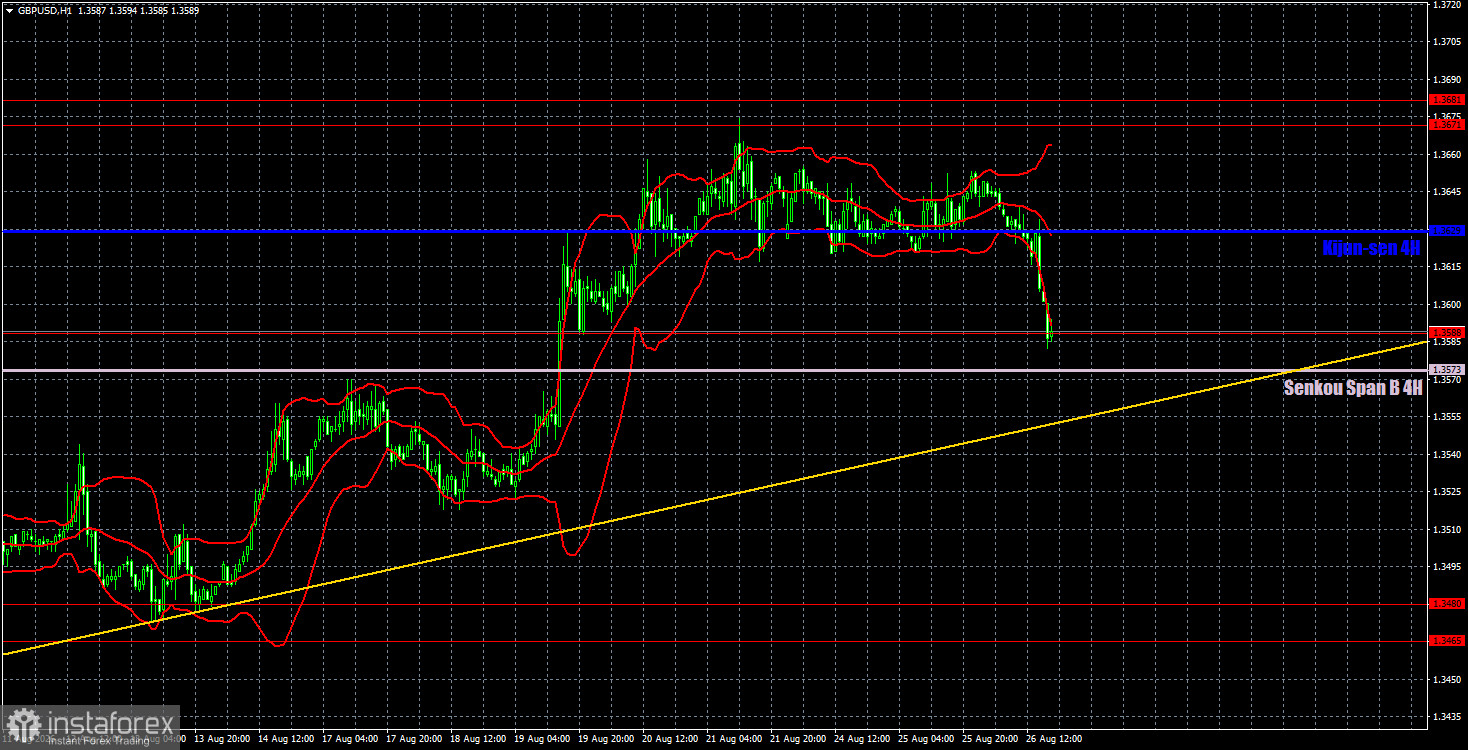
On the hourly timeframe, the GBP/USD pair continues to form an upward trend, as indicated by the trendline and the Ichimoku indicator. In the long run, the British pound continues to look upward. The upward trend will be interrupted if the price closes below the trendline. However, at present, there are no compelling reasons for a powerful strengthening of the dollar. Such reasons may arise on Friday, although it is difficult to expect "hawkish" rhetoric from Warsh or a high value from the Non-Farm Payroll report.
For August 27, we identify the following important levels: 1.3042-1.3050, 1.3096-1.3115, 1.3179-1.3187, 1.3301-1.3309, 1.3369-1.3377, 1.3465-1.3480, 1.3588, 1.3671-1.3681. The Senkou Span B line (1.3573) and the Kijun-sen line (1.3629) may also serve as signal sources. It is recommended to set the stop-loss to break even if the price moves in the right direction by 20 pips. The lines of the Ichimoku indicator may shift throughout the day, which should be taken into account when determining trading signals.
On Thursday, there are no significant events or publications scheduled in the UK, and in the U.S., only the unemployment claims report will be released. Thus, traders will have nothing to react to during the day, and volatility may be low again.
Today, traders may open new short positions with targets at 1.3465-1.3480 if the price closes below the trendline. Long positions can be initiated if a rebound occurs from the 1.3573-1.3588 area, with targets at 1.3629 and 1.3671-1.3681.
Dzięki analizom InstaForex zawsze będziesz na bieżące z trendami rynkowymi! Zarejestruj się w InstaForex i uzyskaj dostęp do jeszcze większej liczby bezpłatnych usług dla zyskownego handlu.


