 Anuluj

Warunki handlowe
Narzędzia


EUR/USD
Analysis:
On the chart of the major European currency pair, a downward wave has continued to form since the beginning of the year. Over the past two months, a corrective wave has been developing. The shape of its extremes most closely resembles a running flat. At the time of analysis, it does not appear to be complete. The lower boundary of a potential large-scale reversal zone on the chart runs through the resistance level.
Forecast:
Over the coming week, the euro is expected to move within a range between the nearest zones of opposing direction. In the first few days, the exchange rate may decline and come under pressure near support. A reversal and the beginning of a price increase may follow. If the direction changes, the price may come under pressure and briefly break through its lower boundary.
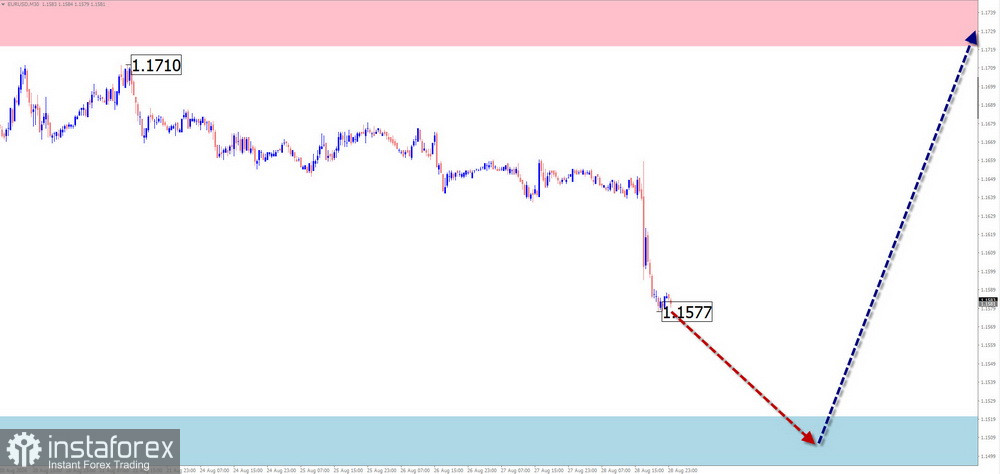
Potential Reversal Zones
Resistance:
Support:
Recommendations:
Buying: Trades may be considered after confirmed signals appear in the support area. The limited potential of the expected upward move should be taken into account.
Selling: The potential is limited; it is advisable to reduce the lot size and restrict trades to individual sessions.
USD/JPY
Analysis:
On the Japanese yen chart, an upward wave that started on August 3 continues to develop in the short-term timeframe. At the end of last week, the price broke through the daily timeframe resistance zone. For the upward move to continue, the price needs to consolidate above this zone. No signals of an imminent reversal are currently visible on the chart.
Forecast:
At the beginning of the coming week, sideways movement with a downward bias can be expected. The price is then likely to move along the support zone. An increase in activity and a resumption of the upward move are likely in the second half of the week. If the direction changes, a sharp increase in volatility cannot be ruled out.
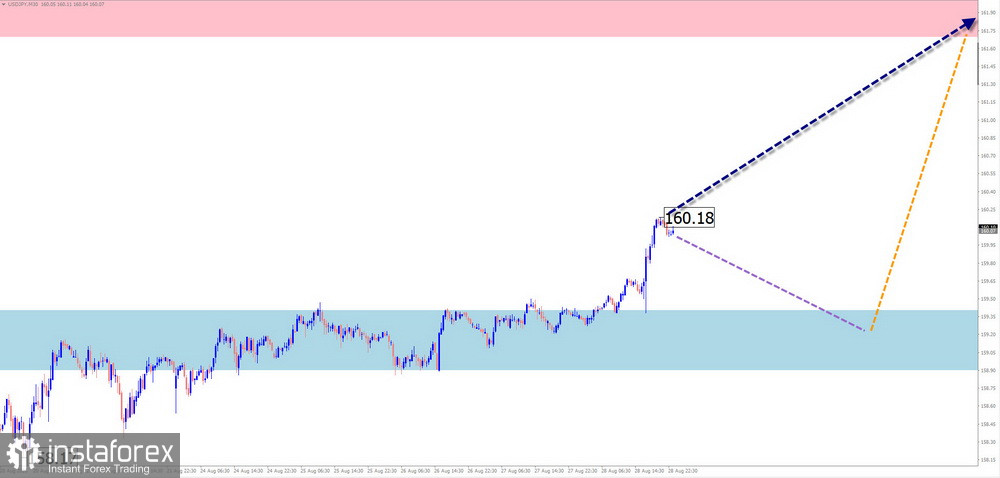
Potential Reversal Zones
Support:
Recommendations:
Selling: There are currently no conditions for such trades in the Japanese yen market.
Buying: Trades may be considered after confirmed signals from your trading systems appear in the reversal zone.
GBP/JPY
Analysis:
On the GBP/JPY pair chart, the upward wave that started on August 3 continues to develop in the short term. Its unfinished corrective section has been developing since the middle of the month. At the time of analysis, the price does not appear to have completed this section. The price has retraced to the support zone.
Forecast:
Over the coming week, the pair is expected to gradually rise toward the resistance zone. At the beginning of the week, brief pressure on the estimated support cannot be ruled out, with a possible break below its lower boundary.
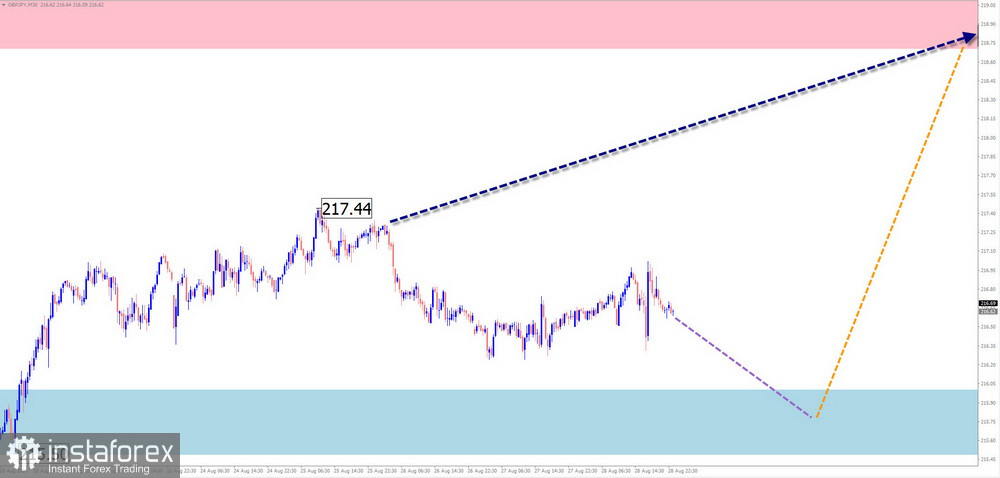
Potential Reversal Zones
Resistance:
Support:
Recommendations:
Buying: Trades may be considered on an intraday basis after confirmed signals from your trading systems appear in the support area.
Selling: Such trades are risky and have limited potential.
USD/CAD
Analysis:
Following a period of weakness in the US dollar against the Canadian currency, the pair entered a correction in mid-August of this year. Analysis of its structure indicates the formation of the final segment (C). The price is approaching the lower boundary of the preliminary target zone.
Forecast:
Over the coming week, the upward movement is expected to continue until it is fully completed near the resistance zone. This may be followed by sideways movement in the price and the formation of conditions for a reversal. A change in the price direction may become possible toward the end of the week.
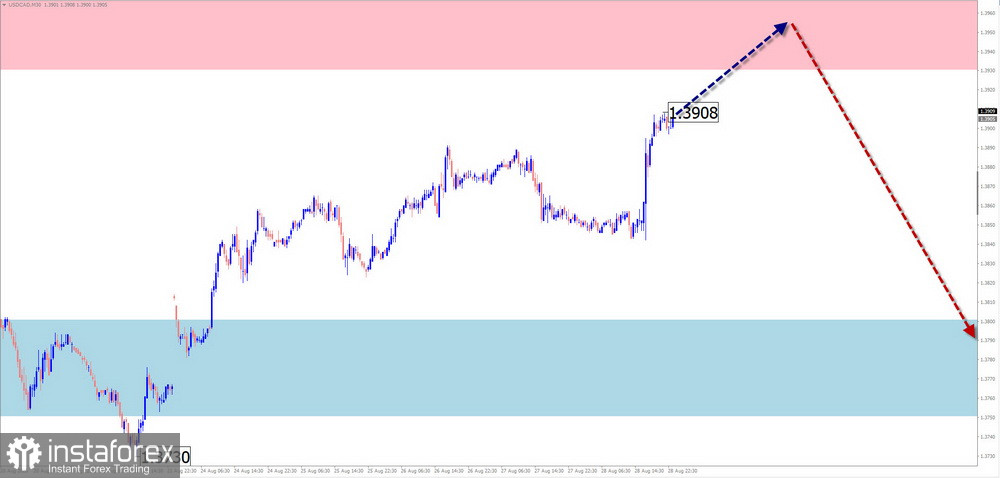
Potential Reversal Zones
Resistance:
Support:
Recommendations:
Selling: Such trades will become relevant after appropriate signals appear near the support zone.
Buying: Trades may be considered with a reduced volume size during individual sessions. Potential is limited by resistance.
NZD/USD
Analysis:
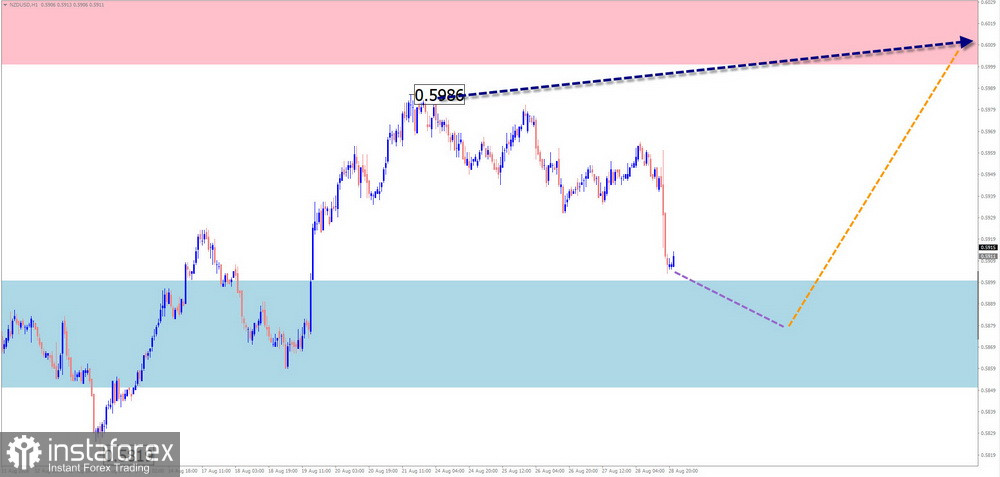
On the major New Zealand dollar pair chart, the primary direction in the short term is being set by an upward wave that started at the end of June this year. An unfinished section moving in the opposite direction from the end of July is forming a correction in the form of a running flat. Analysis of the wave structure indicates that it is complete. However, at the time of analysis, no confirmed signals of a change in direction are visible on the chart.
Forecast:
Over the coming week, the pair is expected to show an overall sideways bias. At the beginning of the week, brief pressure on the support zone cannot be ruled out. A change in direction and a resumption of the decline are possible toward the end of the week. The highest volatility is likely in the second half of the week.
Potential Reversal Zones
Resistance:
Support:
Recommendations
Selling: There is little potential for such trades.
Buying: Trades may become possible after reversal signals appear. Trade potential is limited by the resistance zone.
GOLD
Analysis:
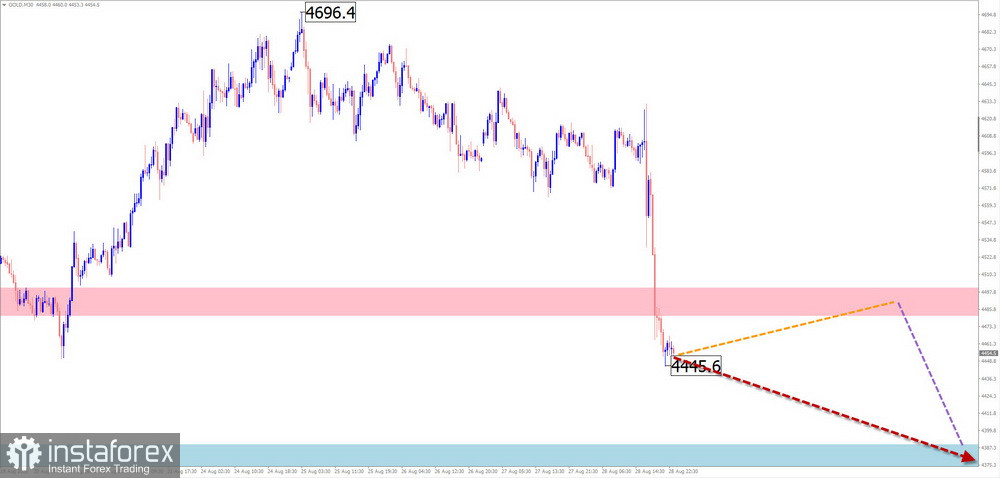
The gold wave structure, which remains incomplete as of today, has been moving in a sideways pattern since the beginning of June this year. The wave structure forms an expanded flat on the chart. Its analysis indicates that the structure remains incomplete at the time of analysis.
Forecast:
In the first half of the coming week, sideways movement with an upward bias is expected, up to contact with the resistance zone. The price may come under pressure near its upper boundary. A reversal may then form in this zone. A continuation of the decline is more likely toward the end of the week.
Potential Reversal Zones
Resistance:
Support:
Recommendations:
Selling: Trades will become possible after confirmed reversal signals appear near the resistance zone.
Buying: Such trades have limited potential and are risky.
#Bitcoin
Analysis:
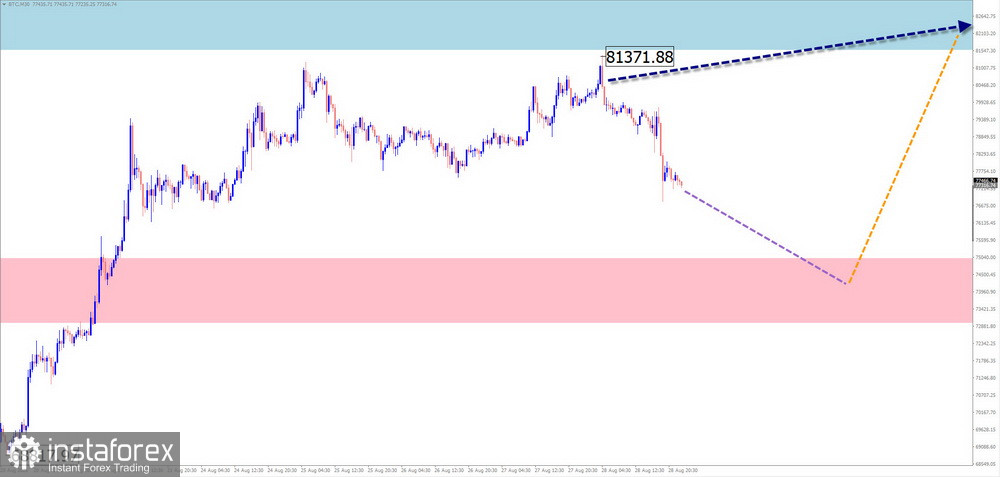
Since February this year, Bitcoin's price fluctuations have been driven by an upward expanded flat. On the higher timeframe chart of the instrument, this section forms a flat corrective wave. Since August 21, following a strong resistance level, the price has been forming a downward section with reversal potential.
Forecast:
In the coming days, the overall sideways movement is expected to continue. A downward retracement is likely toward the estimated support level. The price may then move into a sideways pattern, creating conditions for a reversal. A resumption of the coin's upward movement is possible at the end of the current week or during the following week.
Potential Reversal Zones
Resistance:
Support:
Recommendations:
Selling: The limited downward potential should be taken into account. Trades may be conducted during individual trading sessions using reduced volume sizes.
Buying: Trades may become possible after confirmed signals from your trading systems appear near the resistance zone.
Explanations: In Simplified Wave Analysis (SWA), all waves consist of three parts (A-B-C). On each timeframe, the latest unfinished wave is analyzed. Expected movements are shown with a dashed line.
Attention: The wave algorithm does not take into account the duration of instrument movements over time.
Dzięki analizom InstaForex zawsze będziesz na bieżące z trendami rynkowymi! Zarejestruj się w InstaForex i uzyskaj dostęp do jeszcze większej liczby bezpłatnych usług dla zyskownego handlu.


