 Anuluj
Warunki handlowe
Narzędzia



On Monday, EUR/USD recovered to the 100.0% retracement level at 1.1620. A rebound from this level would favor the US dollar and a resumption of the decline toward the 76.4% Fibonacci level at 1.1551. Consolidation above 1.1620 would allow traders to expect further growth toward the 127.2% retracement level at 1.1700.
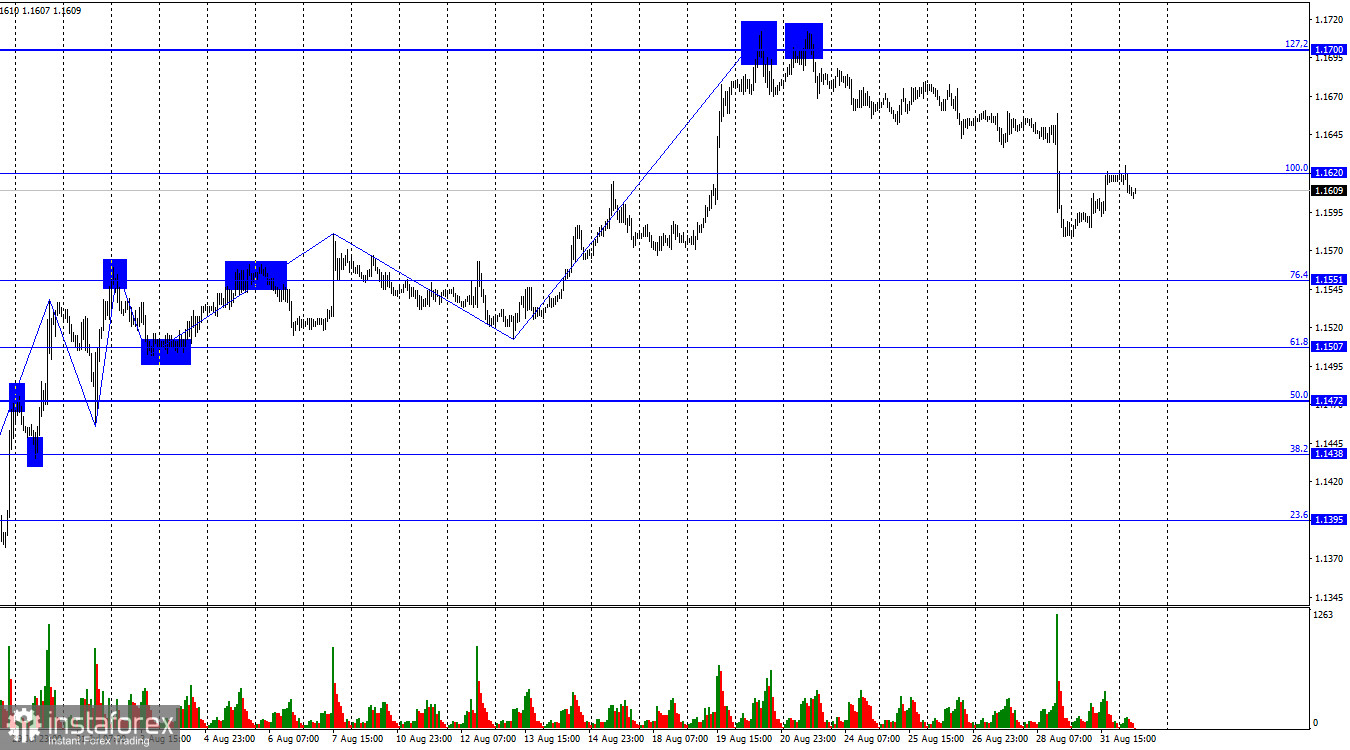
The wave situation on the hourly chart remains bullish. The latest completed upward wave broke above the previous peak, while the new downward wave has not yet broken below the previous low. Geopolitical conditions remain consistently negative: negotiations between Iran and the US are not taking place, and the blockade of the Strait of Hormuz remains in place. However, the FOMC's stance, which remains highly contradictory, is currently more important for the US dollar.
The fundamental background on Monday was highly contradictory. Traders could focus only on Germany's consumer price index, which rose from 2.8% year-on-year to 2.9% year-on-year, but most preferred not to draw any conclusions from this indicator. Today, in just a couple of hours, the euro area inflation report will be released, showing how serious the situation with price growth in Europe is. The ECB will use this report as a basis for its monetary policy decision in a couple of weeks. I would also note that over the past few days, the market has once again started to believe in FOMC monetary policy tightening, but this belief has so far provided very little support for the US currency. Bears attacked aggressively over the past week, but most of the dollar's gains came during just a few hours following Kevin Warsh's speech on Friday. As they say, trust but verify. The market believes the Fed president's statements about the need to combat high inflation, but at the same time, it has serious doubts about monetary policy tightening given the current state of the US economy and labor market. A new Nonfarm Payrolls report will be released this week, so the Fed's policy outlook should become clearer by the end of the week.
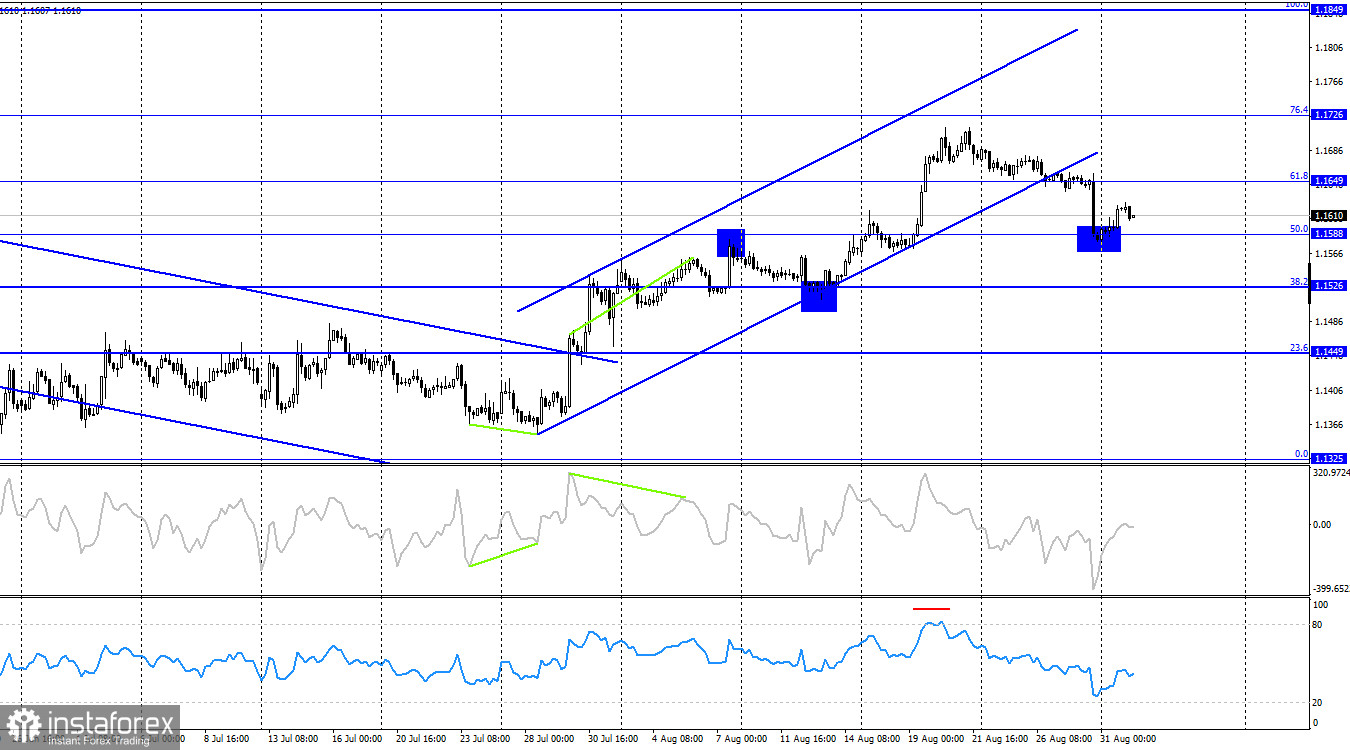
On the 4-hour chart, the pair continues to decline and has consolidated below the upward trend channel. A rebound from the 50.0% Fibonacci level at 1.1588 led to a small recovery in the euro, while consolidation below 1.1588 would allow for expectations of a continued decline toward the next retracement level, 38.2%, at 1.1526. No emerging divergences are currently observed on any of the indicators.
Commitments of Traders (COT) report:
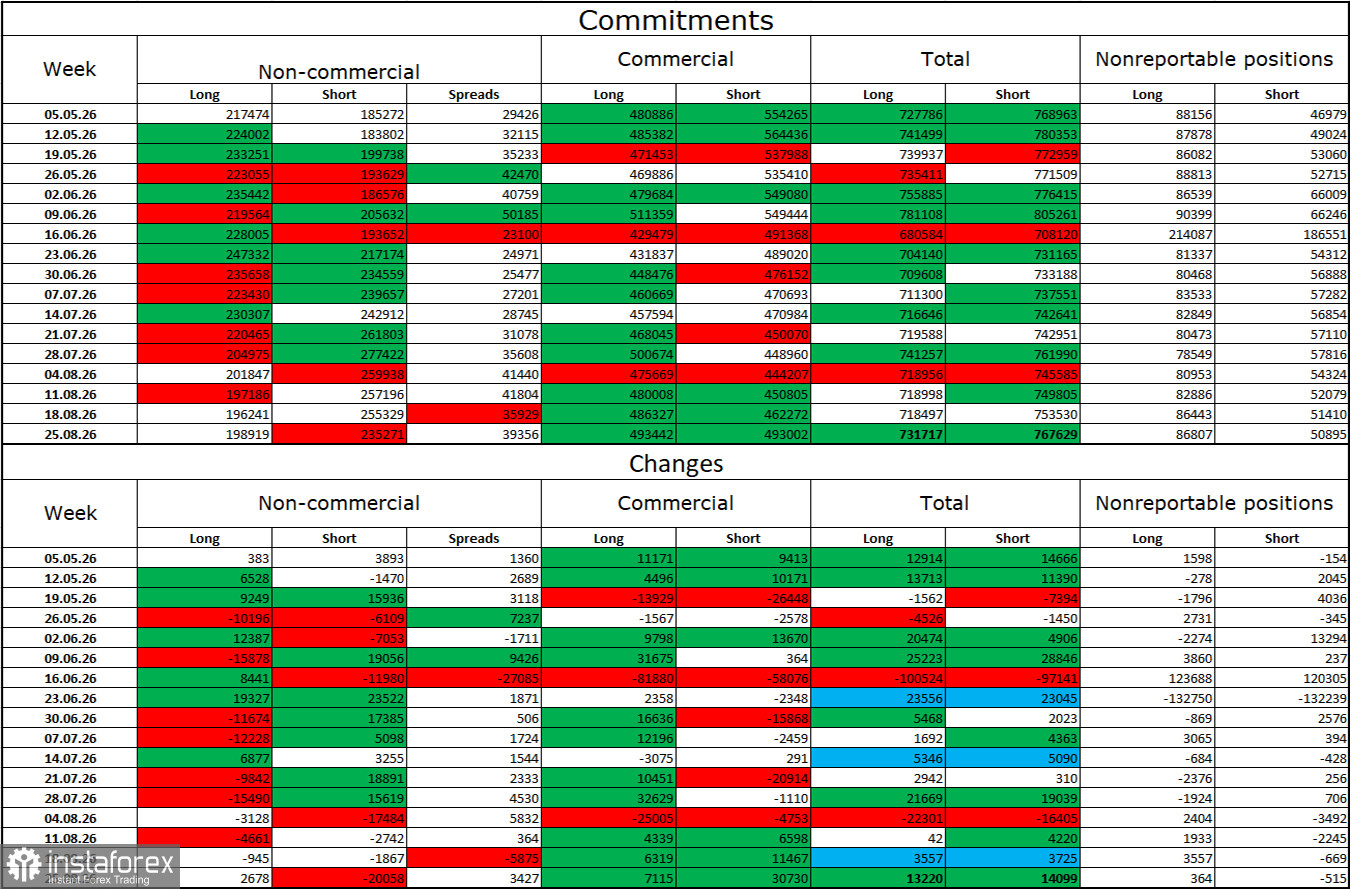
During the latest reporting week, professional traders opened 2,678 Long positions and closed 20,058 Short positions. Over the seven weeks in February and March, the bulls' overwhelming advantage evaporated because of the war in Iran, while over the past 22 weeks, the situation has leveled out amid a supposed truce and market hopes for an end to the war. The total number of Long positions held by speculators currently stands at 198,000, while the number of Short positions stands at 235,000. The bears remain in the lead, but their advantage is rapidly shrinking.
Overall, over the long term, large market participants continue to show considerable interest in the euro. Certainly, events of various kinds around the world, which have been abundant in recent years, affect investor sentiment. In particular, the market is currently keeping a close eye on the situation in the Middle East, where the war alternately appears to end and then resumes. However, geopolitics no longer determines the dollar's fate on its own.
News calendar for the US and the European Union:
On September 1, the economic-events calendar contains four entries. Of these, I would highlight the ISM index and inflation in Europe. The economic background may influence market sentiment on Tuesday.
EUR/USD forecast and trading tips:
Long positions in the pair can be considered today after a close above 1.1620 on the hourly chart, with a target of 1.1700. Short positions were possible after a rebound from 1.1700 on the hourly chart, with a target of 1.1620. Today, a rebound from 1.1620 would allow for new short positions to be opened, with a target of 1.1551.
The Fibonacci grids are drawn from 1.1620–1.1325 on the hourly chart and from 1.1849–1.1325 on the 4-hour chart.
Dzięki analizom InstaForex zawsze będziesz na bieżące z trendami rynkowymi! Zarejestruj się w InstaForex i uzyskaj dostęp do jeszcze większej liczby bezpłatnych usług dla zyskownego handlu.


