 Anuluj

Warunki handlowe
Narzędzia


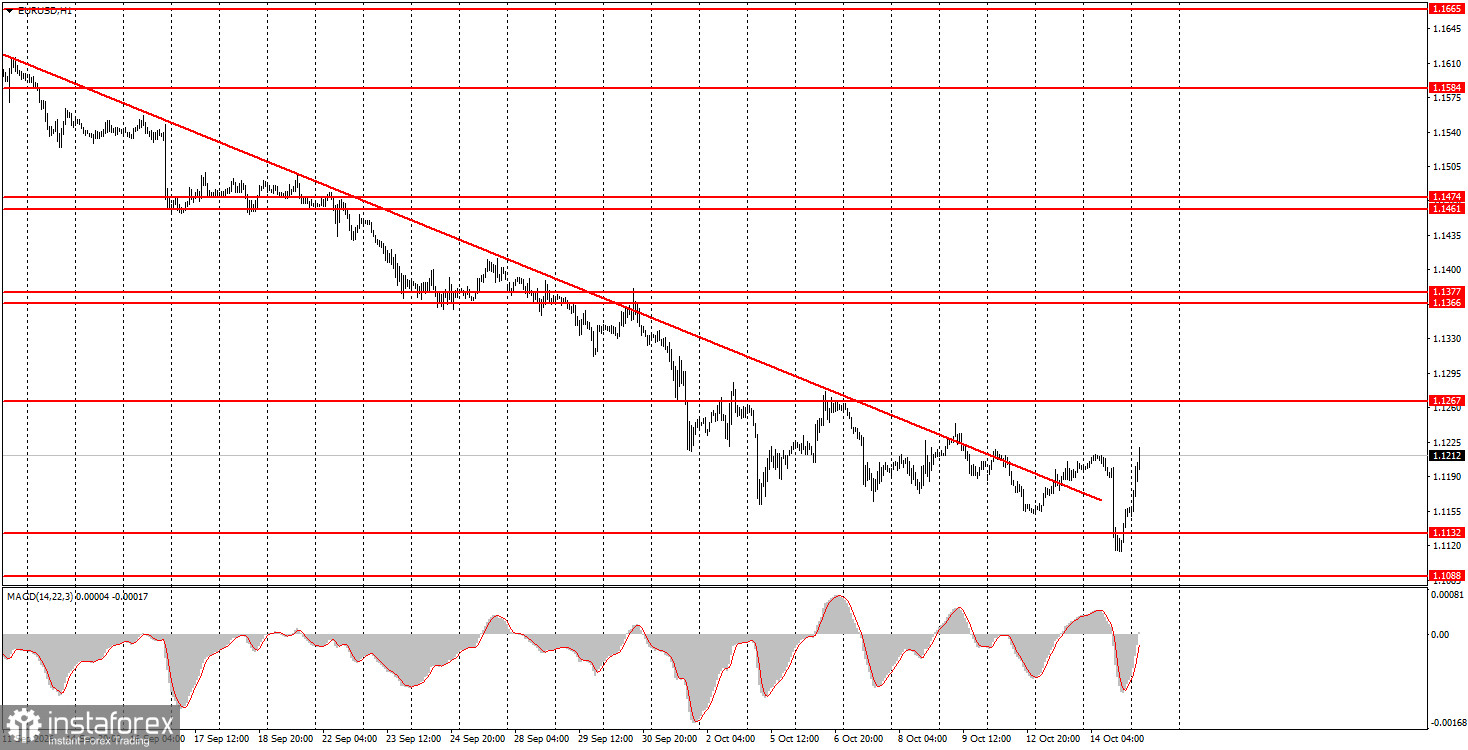
The EUR/USD currency pair plunged like a stone again on Wednesday. This time the trigger was the US inflation report, which came in 0.1% above forecasts. Judge for yourself whether the dollar deserved a 130-pip move on that basis. Interestingly, the Federal Reserve's year-end policy outlook did not materially change after this release. Many traders expected inflation to rise, and Fed officials have repeatedly said consumer-price growth should slow next year and that more than one rate hike is unlikely to be required. So the inflation report didn't change the policy picture, yet it triggered another dollar rally—because the market keeps using any excuse to buy the US currency. By Thursday evening and overnight, the euro somehow recovered to its starting levels, which is at least a light at the end of the tunnel. We still view any dollar strength as illogical and speculative.
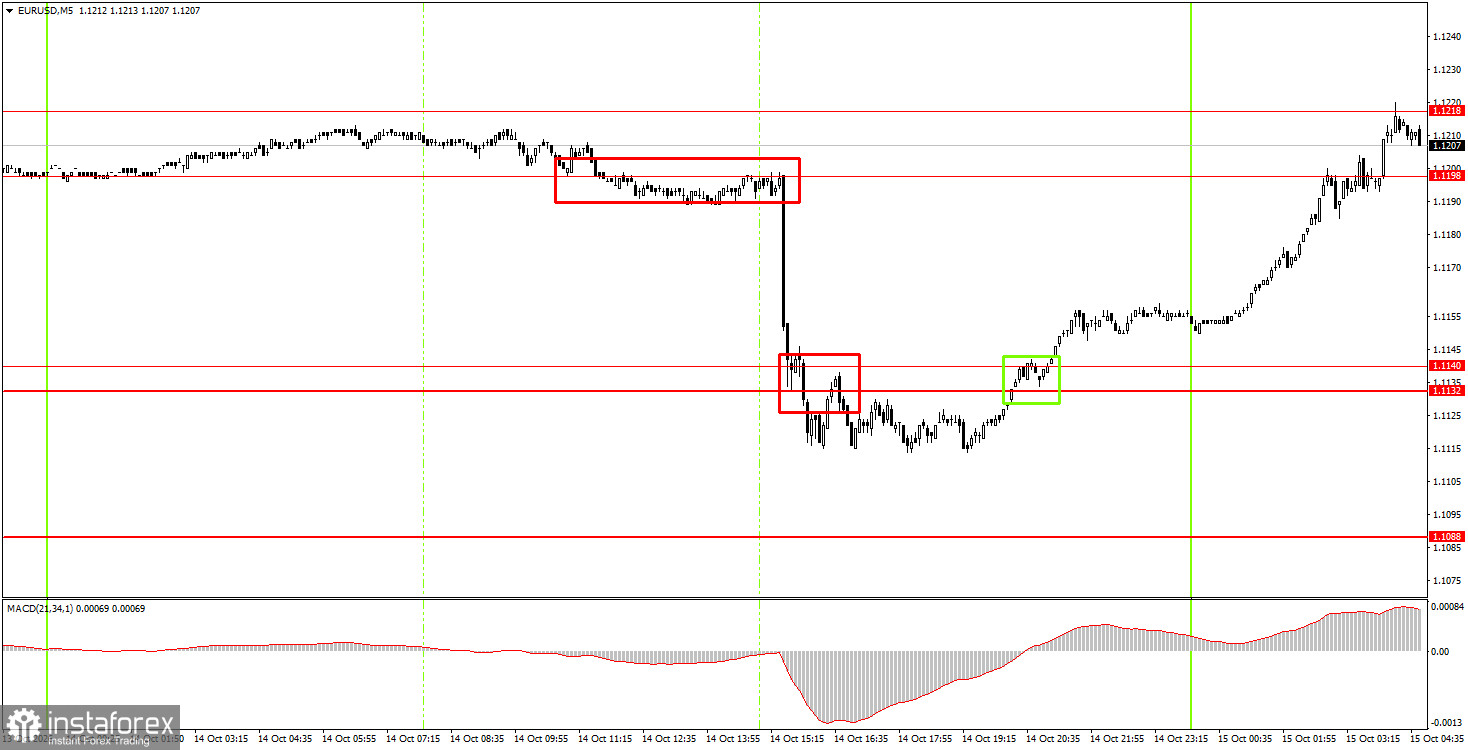
On the 5-minute timeframe on Wednesday, two sell signals and one buy signal formed. Each could have delivered decent profits to novice traders. The first sell signal was hard to trade in real time — price literally collapsed 90 pips in ten minutes. The buy signal in the 1.1132–1.1140 area was easier to work calmly, and this morning the price reached the nearest target 1.1198–1.1218.
On the hourly timeframe, EUR/USD retains a downward tendency that qualifies as a full trend, despite the recent trendline breach. Given recent events, we do not expect the euro to fall like a stone. But the market keeps buying the US dollar regardless of events, releases, or their content.
On Thursday, novice traders may consider new short positions on a rebound from the 1.1198–1.1218 area, targeting 1.1132–1.1140. Open long positions on a close above the 1.1198–1.1218 area, targeting 1.1267–1.1275.
On the 5-minute timeframe consider the levels 1.1011, 1.1088, 1.1132–1.1140, 1.1198–1.1218, 1.1267–1.1275, 1.1366–1.1377, 1.1461–1.1474, 1.1527–1.1531, 1.1584–1.1594, 1.1655–1.1665. On Thursday, the Eurozone will publish industrial-production data, and the US will release the Producer Price Index and Retail Sales. We do not consider these reports important, so market reaction may be muted. The euro will try to continue its recovery today.
Price levels (areas) of support and resistance serve as targets for opening buy or sell trades or as sources of signals.
Red lines indicate channels or trend lines that show the current trend and the preferred trading direction.
The MACD indicator (14,22,3) — the histogram and signal line — is an auxiliary indicator that can also provide signals.
Important speeches and reports (listed in the news calendar) can significantly influence currency pair movements. Therefore, during their release, traders should approach trading with utmost caution, or exit the market to avoid sudden reversals against the preceding move.
Beginner forex traders should remember that not every trade can be profitable. Developing a clear strategy and practicing money management are key to long-term success in trading.
Dzięki analizom InstaForex zawsze będziesz na bieżące z trendami rynkowymi! Zarejestruj się w InstaForex i uzyskaj dostęp do jeszcze większej liczby bezpłatnych usług dla zyskownego handlu.


