 Anuluj


Warunki handlowe
Narzędzia


And the last will be first. The S&P 500 jumped at the start of the week as interest returned to chip makers. The Philadelphia semiconductor index snapped an eight-day losing streak, its longest in 18 years, and many names that had been aggressively sold became the leaders on the upside. Are investors reverting to the old "buy-the-dip" playbook, or has the market merely been granted a brief respite before a major sell-off?
Skeptics argue that the AI bubble will burst sooner or later, as happened with prior technology booms. The outsized rise in tech stocks has left bears convinced that the S&P 500's leaders are speculative. There's some truth to that. When about 70% of expected profits are concentrated in one sector, the overall market inevitably becomes hostage to developments in that sector.
Tech vs. rest — earnings dynamics
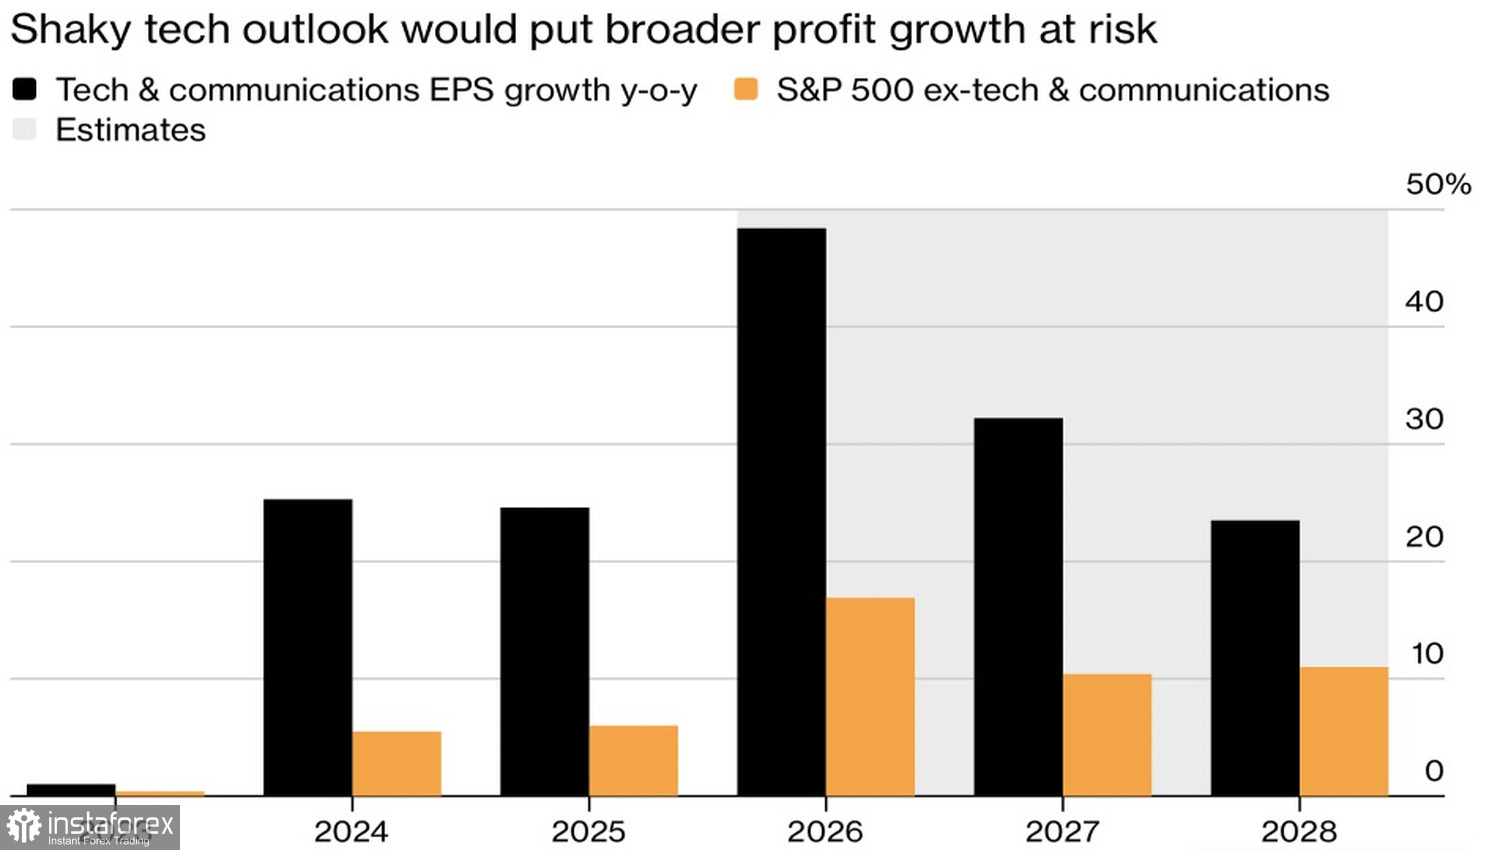
Morgan Stanley, however, believes that the heavy concentration won't last. The bank views November as an opportune month for some rotation into equities — either a modest bleed as money shifts from tech into other sectors or a fresh, robust leg higher for the S&P 500.
It's not just Morgan Stanley that's cautiously optimistic. Seasonality typically favors the last three months of the year, fundamentals have improved in some corners, Treasury yields have eased from recent highs, the US economy remains relatively resilient, and expectations for corporate earnings are biased toward the positive — all factors that can support the S&P 500.
P/E ratio & S&P 500 dynamics
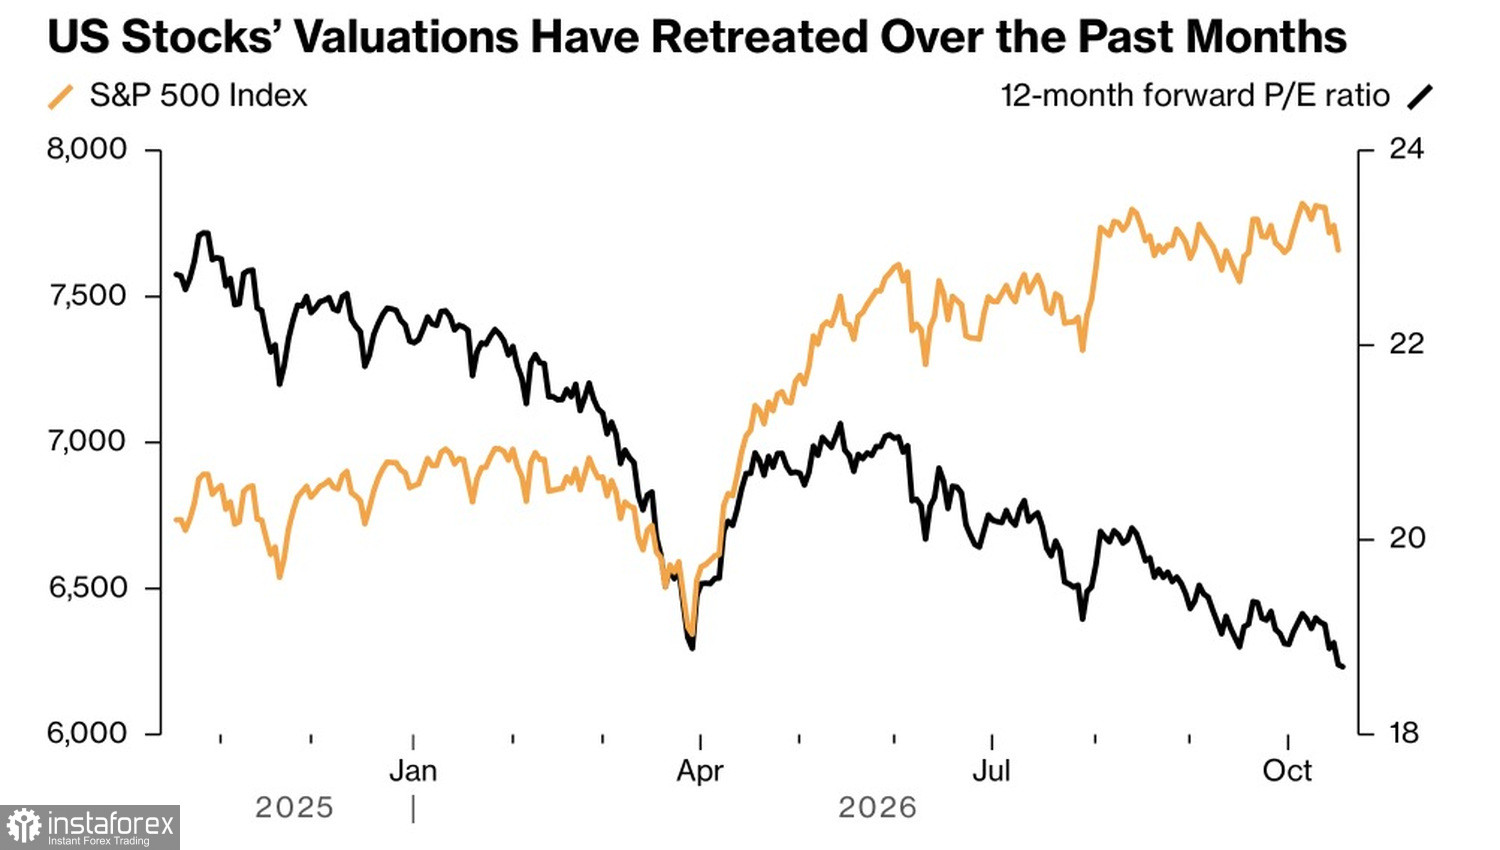
Unfortunately for bulls, the seasonal tailwind isn't proving decisive yet. Wells Fargo calls this earnings season one of the weakest on record. After the first week, actual results have missed Street estimates by around 0.4%, versus an average beat of roughly 4% for similar periods since 2012. Only 48% of companies have topped expectations, compared with a historical 61%.
Investors watch corporate reports with a mix of caution and hope. They're searching for signs that cost trajectories are improving — in prior cycles, such signals often preceded a broader market downturn. The logic is simple: the less companies invest, the smaller the profits for those selling into that investment cycle.
Baird research shows it typically takes six to 12 months between the S&P 500 peaking and a visible slowdown in capex. That implies the current earnings season is unlikely to settle the debate over AI beneficiaries' durability — though it can certainly set the next direction for the broad index.
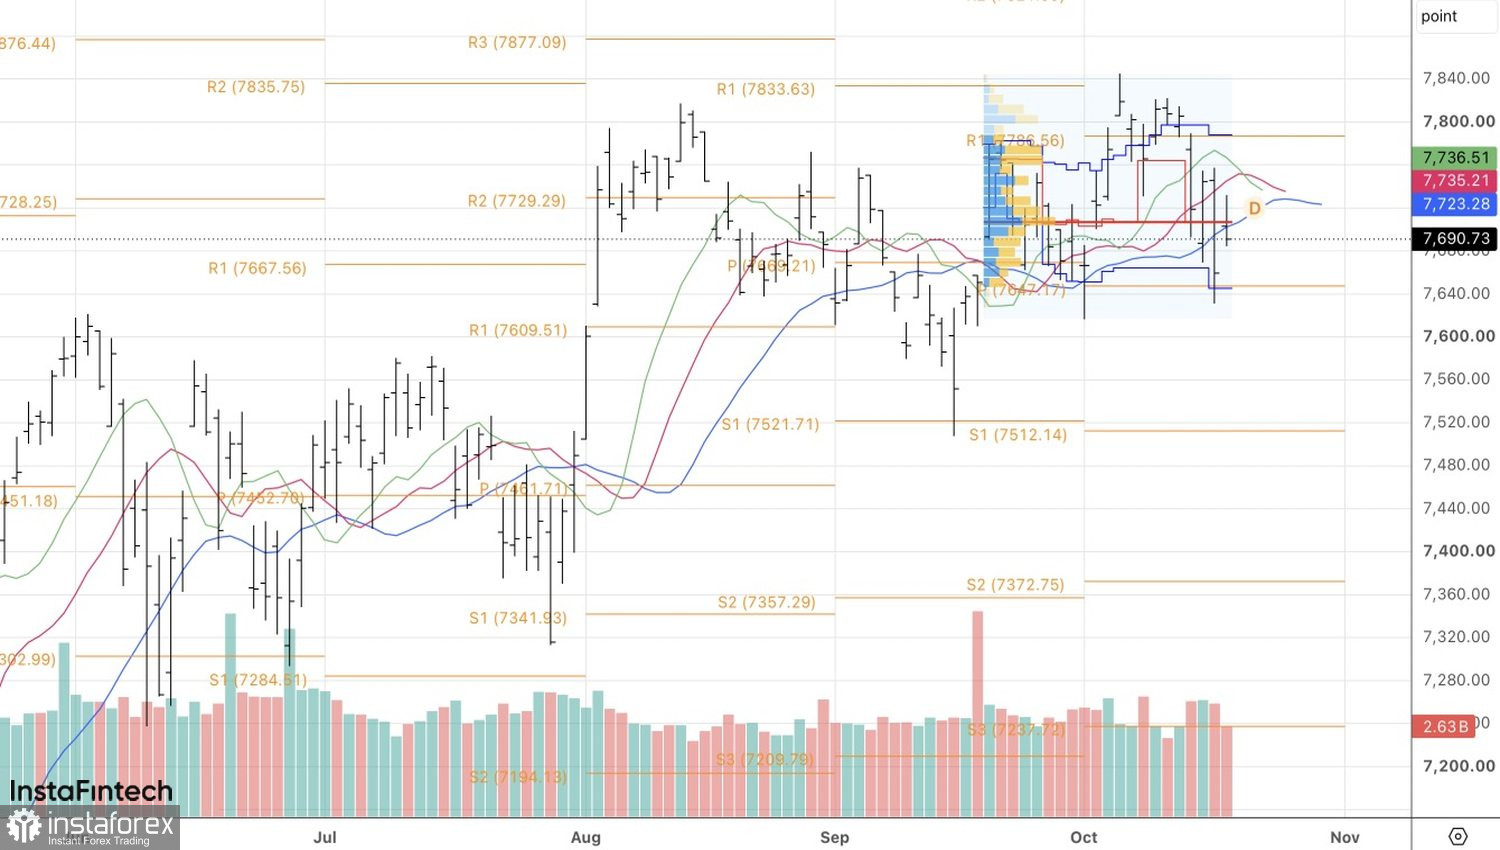
As for technicals, the S&P 500 has formed an inside bar on the daily chart, signaling indecision. A practical plan is to place pending orders around the bar's range: a buy stop near the high (~7,730) and a sell stop near the low (~7,865) to play either breakout.
Dzięki analizom InstaForex zawsze będziesz na bieżące z trendami rynkowymi! Zarejestruj się w InstaForex i uzyskaj dostęp do jeszcze większej liczby bezpłatnych usług dla zyskownego handlu.


