 Anuluj


Warunki handlowe
Narzędzia


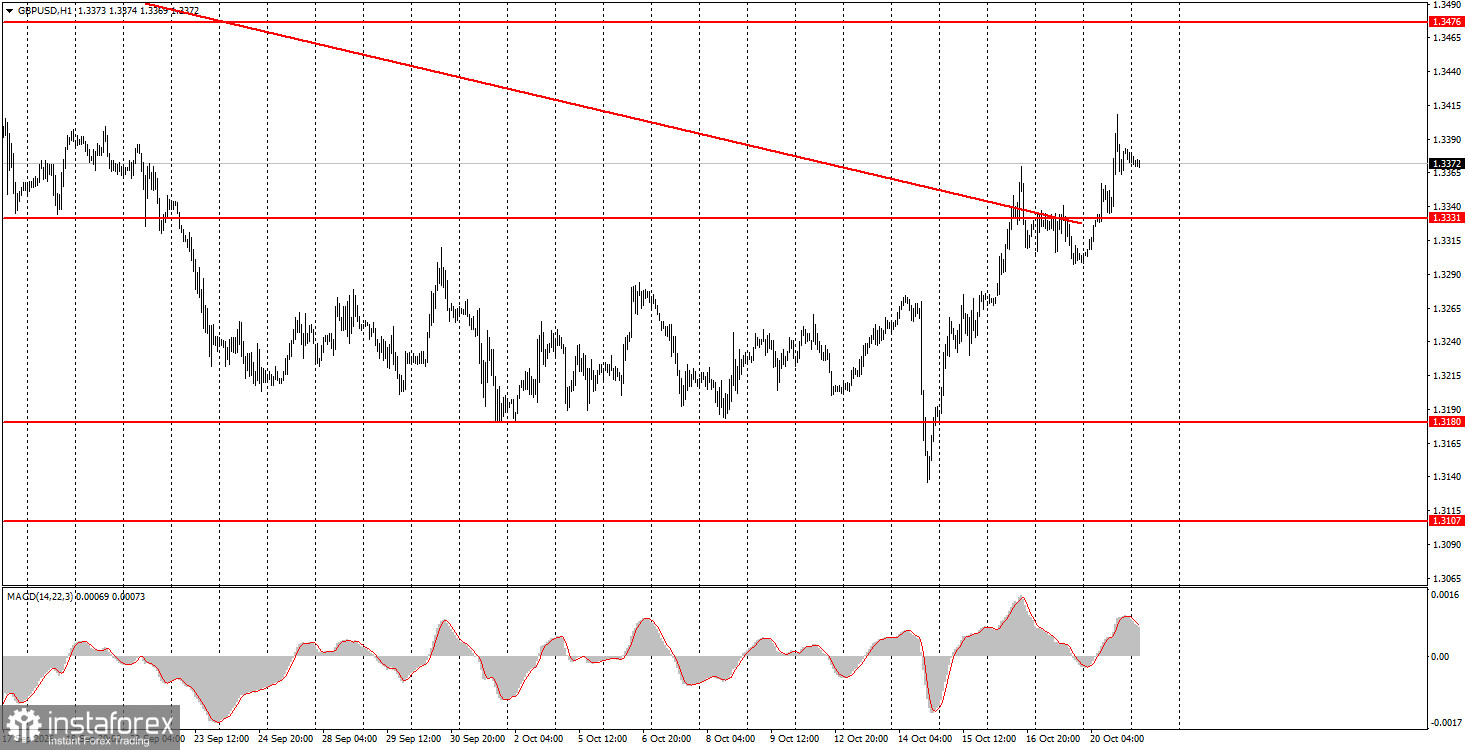
GBP/USD posted another impressive rise on Tuesday—the third strong up day in the last four trading sessions. As we noted earlier, sterling has shown more resilience against the dollar than the euro. The pound's advance is understandable for several reasons. Sterling has had no solid fundamental reasons to collapse over the past month, and after clearing lower boundaries on higher timeframes, a technical rebound was likely. Yesterday, the pound also found support from macro data the market reacted to: the UK unemployment rate unexpectedly fell from 4.9% to 4.7%, which naturally supported the currency. Today's UK inflation release will be a major test for the pound because it will heavily influence the Bank of England's rate decision in two weeks.
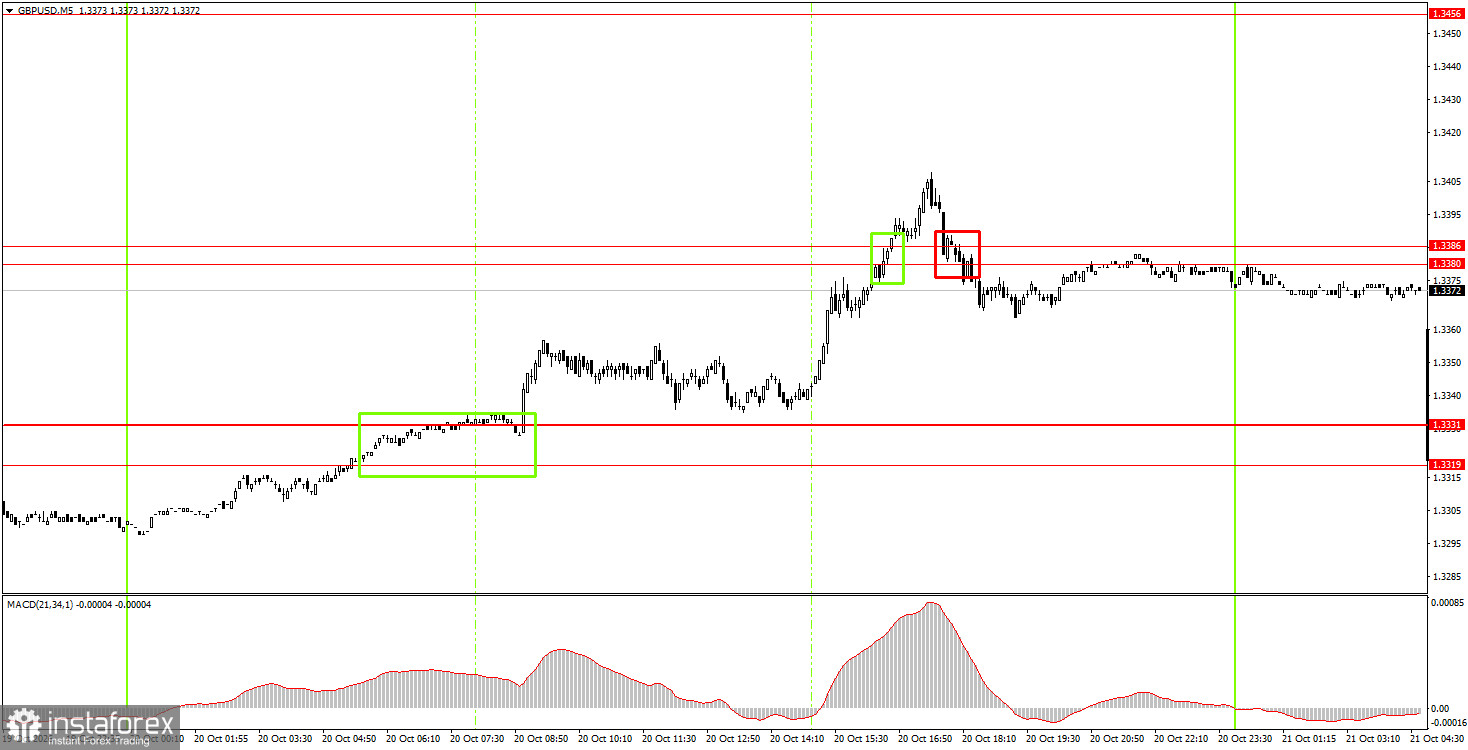
On the 5-minute chart, Tuesday produced three trading signals. Early in the European session, price overcame the 1.3319–1.3331 zone, allowing long positions. During the US session, the pair overcame 1.3380–1.3386 but failed to hold and retreated below that area after a few hours. That produced a sell signal, and traders could have closed longs profitably at roughly 25 pips.
On the hourly timeframe, GBP/USD has a good chance of completing the month-long downtrend. The pound has shown notable resilience vs. the dollar in recent weeks and now has a higher chance of entering an uptrend. The technical picture across most charts supports a move higher for sterling. Fundamentals, macro context, and an overbought dollar also favor GBP/USD strength.
On Wednesday, novice traders may keep short positions with a target of 1.3319–1.3331 as long as price stays below 1.3380–1.3386. Consider longs with a target of 1.3456–1.3476 if price closes above 1.3380–1.3386.
On the 5-minute timeframe watch these levels: 1.3043, 1.3096–1.3107, 1.3175–1.3180, 1.3259–1.3267, 1.3319–1.3331, 1.3380–1.3386, 1.3456–1.3476, 1.3587–1.3598, 1.3631–1.3641. The UK September inflation report will be published on Wednesday and is likely to impact the Bank of England's rate outlook significantly. The US calendar is empty today, so price action will likely be driven mainly by UK data and European session flows.
Price levels (areas) of support and resistance serve as targets for opening buy or sell trades or as sources of signals.
Red lines indicate channels or trend lines that show the current trend and the preferred trading direction.
The MACD indicator (14,22,3) — the histogram and signal line — is an auxiliary indicator that can also provide signals.
Important speeches and reports (listed in the news calendar) can significantly influence currency pair movements. Therefore, during their release, traders should approach trading with utmost caution, or exit the market to avoid sudden reversals against the preceding move.
Beginner forex traders should remember that not every trade can be profitable. Developing a clear strategy and practicing money management are key to long-term success in trading.
Dzięki analizom InstaForex zawsze będziesz na bieżące z trendami rynkowymi! Zarejestruj się w InstaForex i uzyskaj dostęp do jeszcze większej liczby bezpłatnych usług dla zyskownego handlu.


