 Zůstat
Obchodní podmínky
Nástroje


On Thursday, the main focus of investors was on two consecutive central bank meetings, the results of which led to the emergence of market speculations.
First, the Bank of England presented its report, which, as expected, maintained the interest rate at 5.25%. However, three out of nine votes favored a slight rate increase of 25 basis points, similar to the previous meeting. It is important to note that the Bank of England has not yet decided to halt further rate hikes, emphasizing that monetary policy is likely to remain restrictive for an extended period.
Following that, the European Central Bank (ECB) released its report, where, without surprises, the rate was left at 4.5%. The regulator emphasized that interest rates are at levels that, if maintained for a long time, will make a significant contribution to achieving the inflation target. The ECB expressed its intention to keep rates at the level of restrictive policy, without hinting at possible rate hikes.
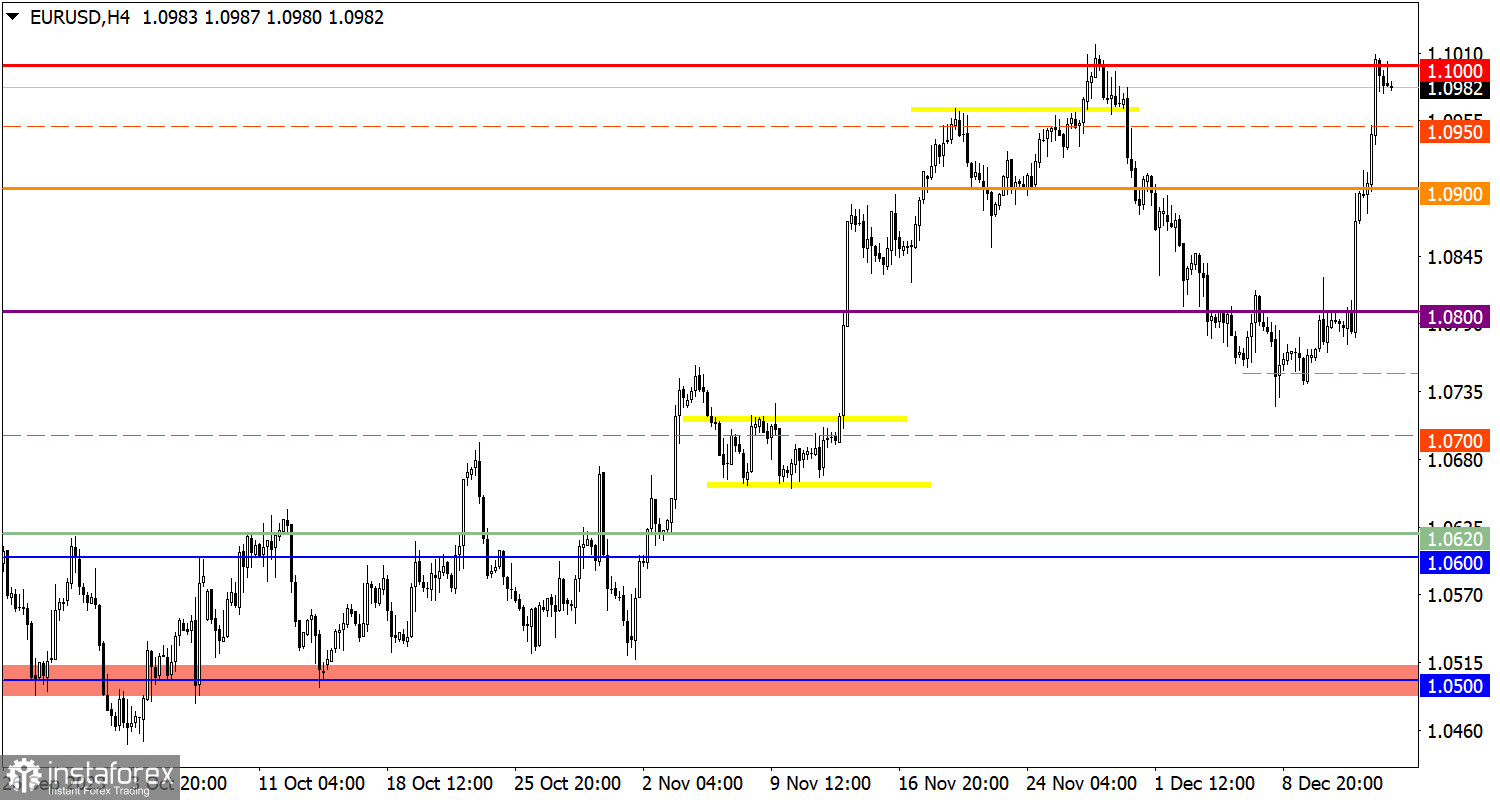
EUR/USD is significantly recovering its positions. Since the beginning of the current trading week, the exchange rate has strengthened by 2.5%, almost 100% from the recent correction level. In fact, technical signs of the resumption of the upward cycle can already be identified.
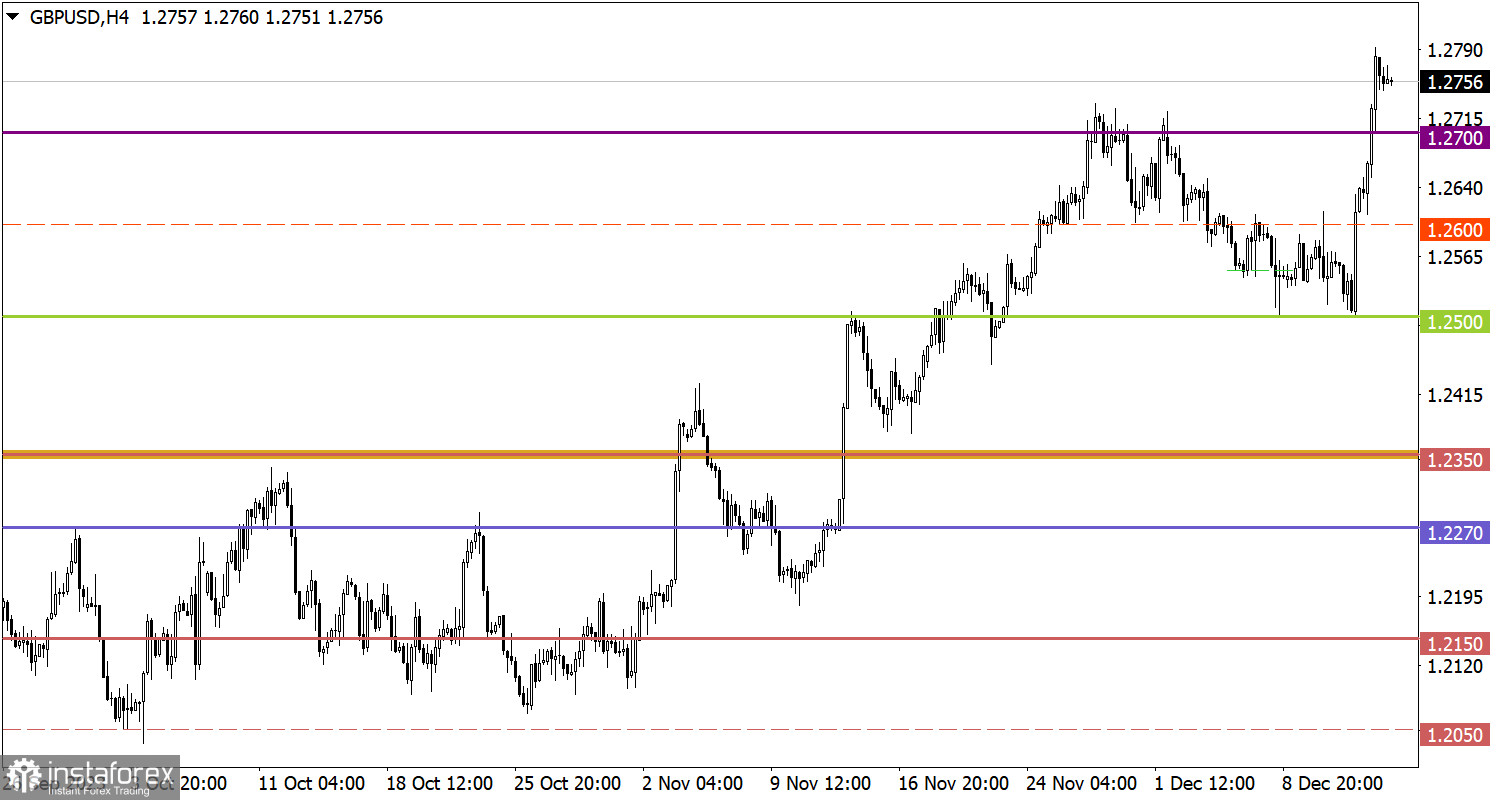
Speculative activity also supported the recovery of the GBP/USD exchange rate, leading not only to the restoration of value after the correction movement but also causing a prolonged upward cycle.
Today, preliminary data on business activity indices in the European Union, the United Kingdom, and the United States is expected to be published. Forecasts suggest growth, with expectations of index growth in the Old World and a slight decline in the New World. However, it should be noted that these are only preliminary forecasts by analysts, and actual data may differ from expectations.
Stabilization of the price above the level of 1.1000 opens the way for further growth, despite the technical signal of overbought conditions. In this case, an extension of the upward cycle is possible. However, if the level of 1.1000 proves to be resistance, the market may face a local price pullback.
The market shows inertial-speculative movement, ignoring the technical signal of overbought conditions for the British Pound. Consequently, further upward movement is possible, especially if the quote surpasses the 1.2800 mark. However, in the case of a price pullback, a local decrease to 1.2700 is not excluded.
The candlestick chart type is white and black graphic rectangles with lines above and below. With a detailed analysis of each individual candle, you can see its characteristics relative to a particular time frame: opening price, closing price, intraday high and low.
Horizontal levels are price coordinates, relative to which a price may stop or reverse its trajectory. In the market, these levels are called support and resistance.
Circles and rectangles are highlighted examples where the price reversed in history. This color highlighting indicates horizontal lines that may put pressure on the asset's price in the future.
The up/down arrows are landmarks of the possible price direction in the future.
Díky analytickým přehledům společnosti InstaForex získáte plné povědomi o tržních trendech! Jako zákazníkovi společnosti InstaForex je Vám k dispozici velký počet bezplatných služeb umožňujících efektivní obchodování.


