 Zůstat
Obchodní podmínky
Nástroje

The index is looking to test the resistance zone of 102.39, where a breakout should deliver more bulls' force in order to cling towards 103.40. As the index still hovers around the 200 SMA at H1 chart, it's possible to see a pullback to take place and if that happens, the next target to the downside would be the 100.44 level.
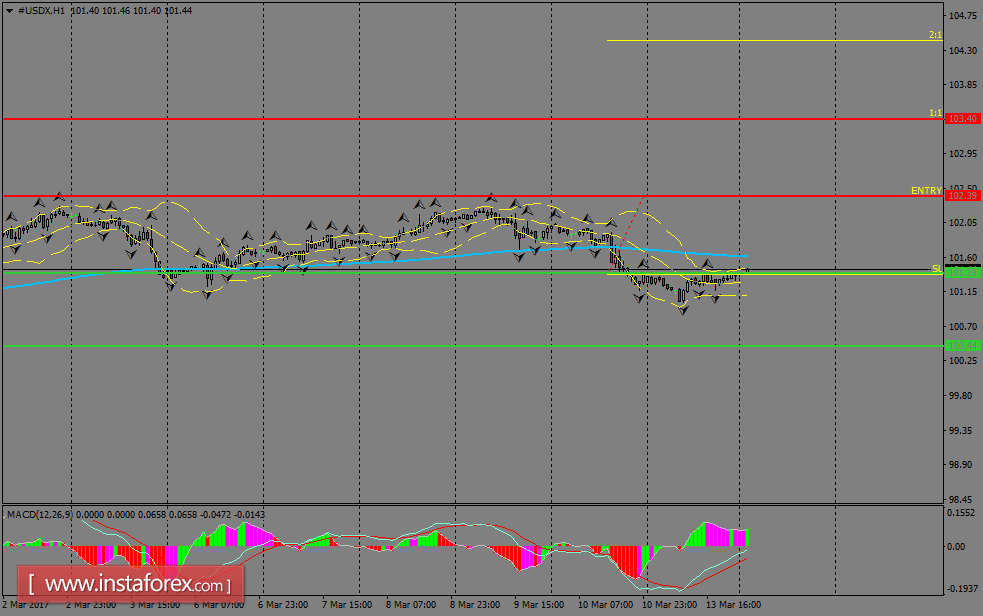
H1 chart's resistance levels: 102.39 / 103.40
H1 chart's support levels: 101.39 / 100.44
Trading recommendations for today: Based on the H1 chart, place buy (long) orders only if the USD Index breaks with a bullish candlestick; the resistance level is at 102.39, take profit is at 103.40 and stop loss is at 101.35.
Díky analytickým přehledům společnosti InstaForex získáte plné povědomi o tržních trendech! Jako zákazníkovi společnosti InstaForex je Vám k dispozici velký počet bezplatných služeb umožňujících efektivní obchodování.


