empty
 
 
You are about to leave
www.instaforex.eu >
a website operated by
INSTANT TRADING EU LTD
Open Account

14.03.201701:39 Forex Analysis & Reviews: Daily analysis of USDX for March 14, 2017

Long-term review
This information is provided to retail and professional clients as part of marketing communication. It does not contain and should not be construed as containing investment advice or investment recommendation or an offer or solicitation to engage in any transaction or strategy in financial instruments. Past performance is not a guarantee or prediction of future performance. Instant Trading EU Ltd. makes no representation and assumes no liability as to the accuracy or completeness of the information provided, or any loss arising from any investment based on analysis, forecast or other information provided by an employee of the Company or otherwise. Full disclaimer is available here.

The index is looking to test the resistance zone of 102.39, where a breakout should deliver more bulls' force in order to cling towards 103.40. As the index still hovers around the 200 SMA at H1 chart, it's possible to see a pullback to take place and if that happens, the next target to the downside would be the 100.44 level.

Exchange Rates 14.03.2017 analysis

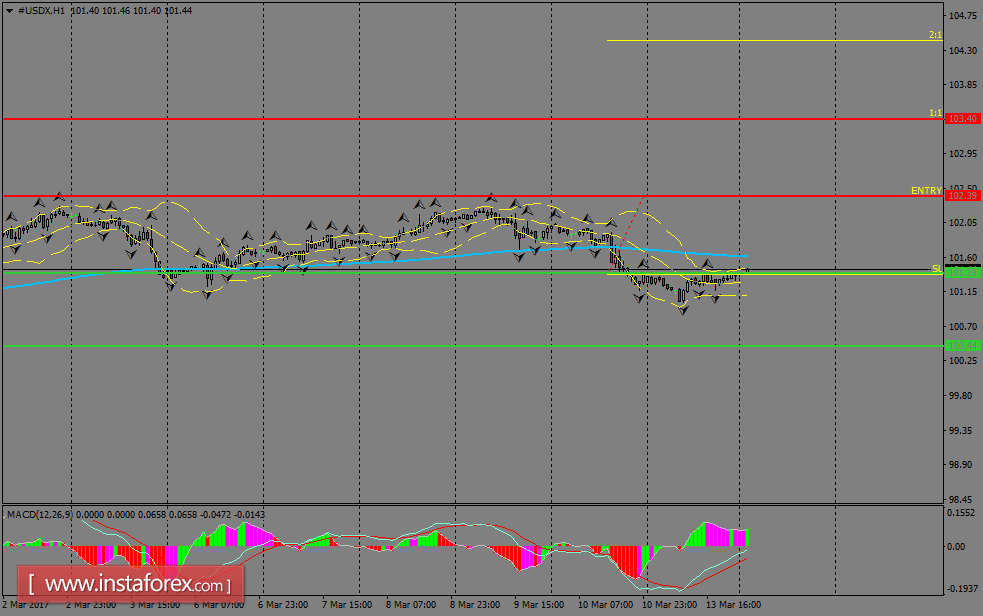
H1 chart's resistance levels: 102.39 / 103.40

H1 chart's support levels: 101.39 / 100.44

Trading recommendations for today: Based on the H1 chart, place buy (long) orders only if the USD Index breaks with a bullish candlestick; the resistance level is at 102.39, take profit is at 103.40 and stop loss is at 101.35.

InstaForex Analyst
Analytical expert of InstaForex
© 2007-2025

Open trading account

InstaForex analytical reviews will make you fully aware of market trends! Being an InstaForex client, you are provided with a large number of free services for efficient trading.


You are now leaving www.instaforex.eu, a website operated by INSTANT TRADING EU LTD
Can't speak right now?
Ask your question in the chat.
Widget callback

Turn "Do Not Track" off