 Stay
Stay 
Trading Conditions
Products
Tools


Gold price is making new 2020 highs as we expected from our previous posts. Gold price has first managed to recapture $1,700 which was a crucial pivot point and many battles were given there. Once support was solid, bulls broke above the lower highs trend line resistance.
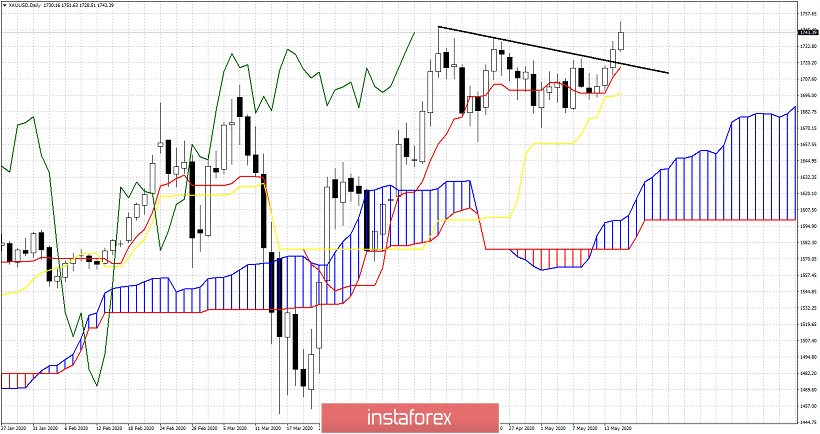
Gold price remains in a bullish trend. We noted in our previous analysis that a break above $1,720 would bring price to new 2020 highs. Now $24 higher we are above the resistance trend line and still above both the tenkan-sen and the kijun-sen. Support is found at $1,716 and next at $1,694. The latter is the most important one. Gold price could continue higher towards $1,770-80 area before making at least a short-term top.
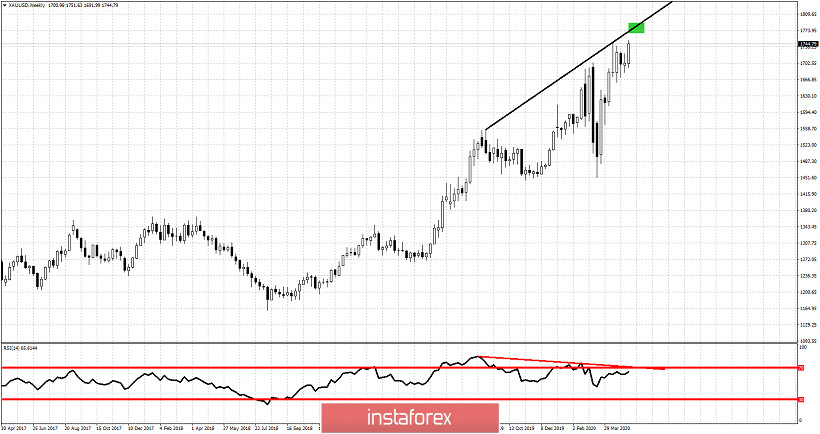
Green rectangle - target
Gold price is making new highs. The weekly RSI is not. What does this mean? A reversal could come over the coming weeks. This reversal will be confirmed on a break below $1,694. As I explained in our latest posts, although I'm bearish Gold around $1,740-50, this time is different, because the break out pattern points to higher levels. $1,770-80 is very possible targets. Yes another bearish divergence may come, but I prefer to wait and look for short positions near that target green area.
InstaForex analytical reviews will make you fully aware of market trends! Being an InstaForex client, you are provided with a large number of free services for efficient trading.


