 Stay
Stay 
Trading Conditions
Products
Tools


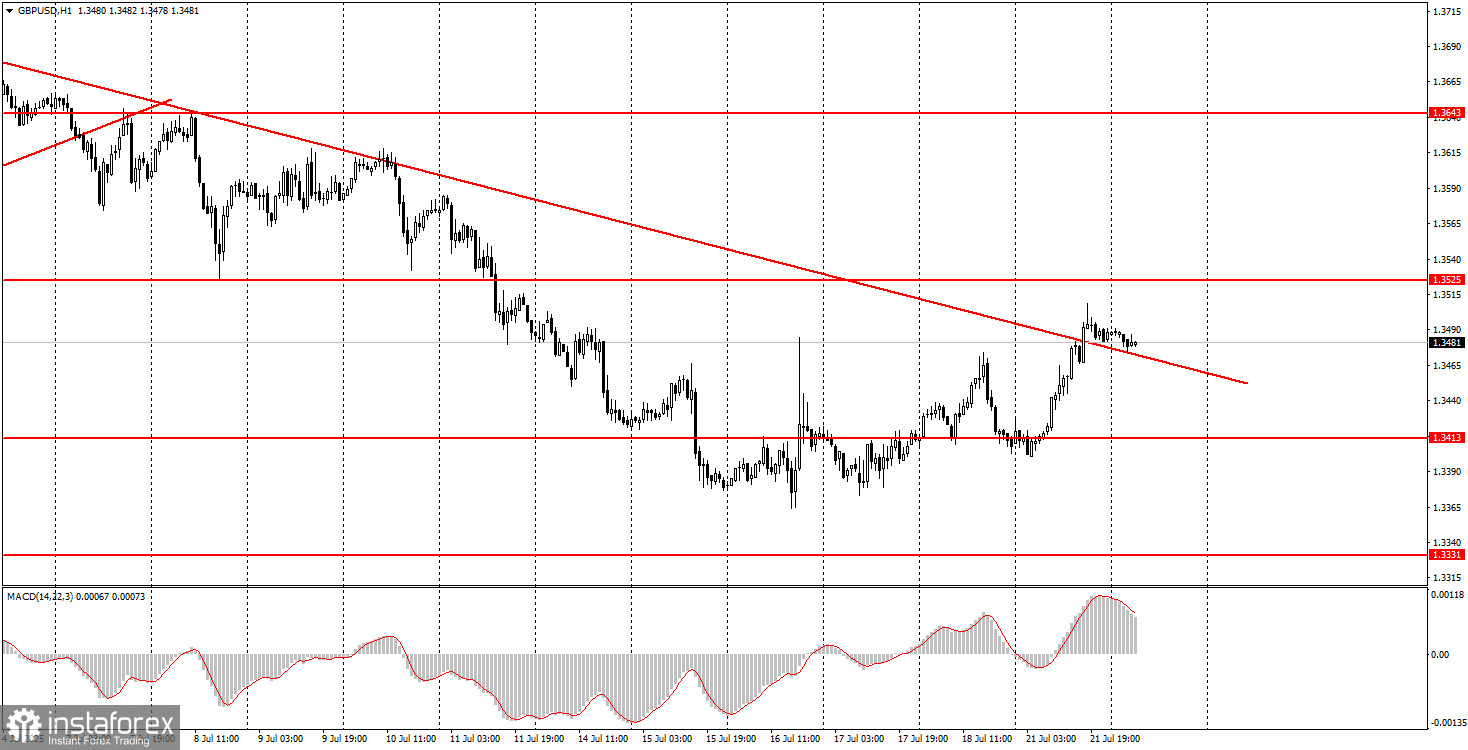
On Monday, the GBP/USD pair exhibited movements nearly identical to those of the EUR/USD pair. This suggests that the US dollar has entered a new phase of weakening across the market. Both currency pairs consolidated above their descending trendlines, signaling the end of the downward trend. In both cases, the dollar's strength over the past three weeks was driven purely by technical reasons—mainly the need for periodic corrections. Now the market may start to recall all those fundamental factors that were working against the dollar but had not yet been reflected in price action.
Obviously, the dollar will not decline forever. There will be extended periods of correction or even local downward trends. However, until 2025, the US currency had been appreciating for 16 years. And we know that global trends change just like local ones. If we are currently at the beginning of a new trend, the dollar may continue to fall for quite some time. For the market, the trade war remains the most important factor—and there is still no positive news on that front.
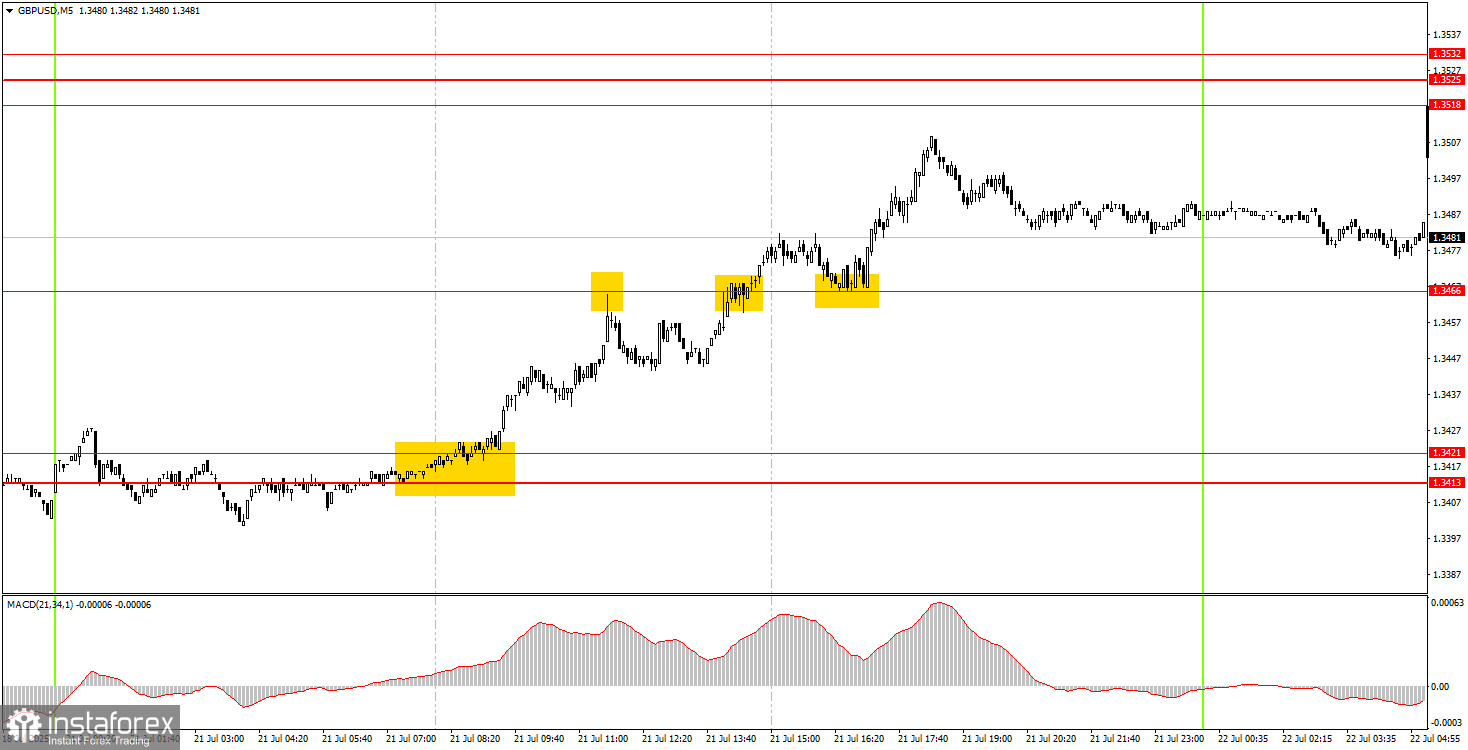
On the 5-minute timeframe, several decent trading signals were formed on Monday. At the very beginning of the European session, the price rebounded from the 1.3413–1.3421 area, leading to a relatively strong upward move. Unfortunately, the price stopped near the 1.3466 level and even generated a sell signal. As a result, long positions had to be closed, and the shorts generated no profit. However, the next buy signal near the same level allowed for reopening long positions, which turned out to be profitable. Ultimately, two out of three trades were successful.
On the hourly timeframe, the GBP/USD pair shows readiness to form a new local upward trend. The price has consolidated above the descending trendline, indicating a potential rise in the coming weeks. Moreover, the fundamental background continues to work against the US dollar.
On Tuesday, the GBP/USD pair may continue moving upward toward the 1.3525 level. It is quite common for the price to retrace slightly after breaking through a trendline and then resume the new trend.
On the 5-minute timeframe, you can trade based on the following levels: 1.3203–1.3211, 1.3259, 1.3329–1.3331, 1.3413–1.3421, 1.3466, 1.3518–1.3525, 1.3574–1.3590, 1.3643–1.3652, 1.3682, 1.3763, 1.3814–1.3832.
On Tuesday, the only noteworthy event is Jerome Powell's speech. Of course, one should not forget that Donald Trump may provoke a new "market storm" at any moment.
Support and Resistance Levels: These are target levels for opening or closing positions and can also serve as points for placing Take Profit orders.
Red Lines: Channels or trendlines indicating the current trend and the preferred direction for trading.
MACD Indicator (14,22,3): A histogram and signal line used as a supplementary source of trading signals.
Important Events and Reports: Found in the economic calendar, these can heavily influence price movements. Exercise caution or exit the market during their release to avoid sharp reversals.
InstaForex analytical reviews will make you fully aware of market trends! Being an InstaForex client, you are provided with a large number of free services for efficient trading.


