 Stay
Stay 
Trading Conditions
Products
Tools



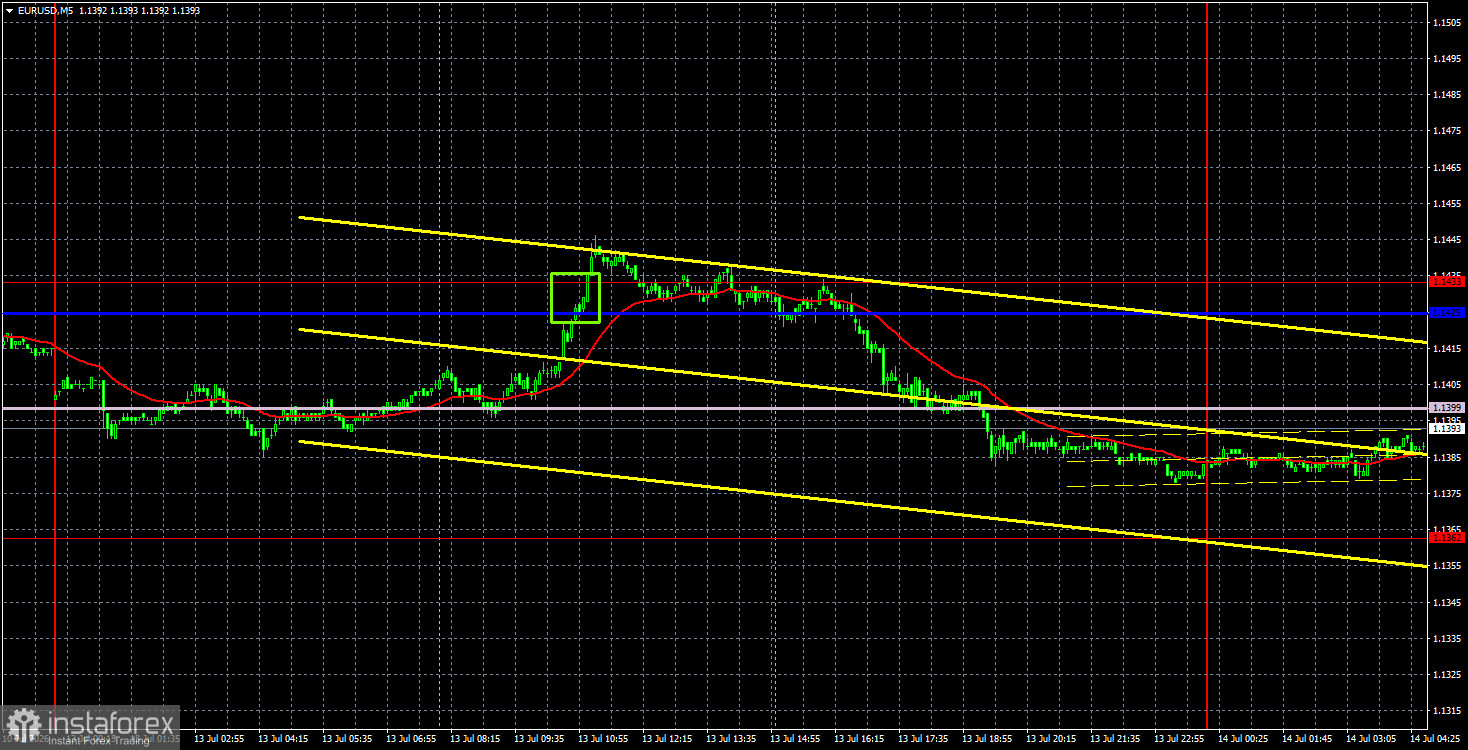
The EUR/USD currency pair continued to trade with minimal volatility, primarily sideways, on Monday. Overall, we have observed low-volatility movement for the eighth consecutive day, exhibiting all the signs of a flat. This is not surprising, as there are very few news reports and data available to traders. What have we learned from Monday? Only that the conflict in the Middle East is now much closer to prolonged escalation and confrontation than to peace and a deal. Tehran and Washington continue to hold their positions, trying to force the opponent to adopt their own viewpoint by any means available. Naturally, this method is not working. As a result, oil has risen to $85 and is likely to continue rising since the Strait of Hormuz is once again closed, making safe passage for vessels through it out of the question. The market is already tired of geopolitical factors, so it reacts cautiously to such news. And there is simply no other significant news.
From a technical perspective, a new downward trend may now begin. The ascending trend line has been breached, the Ichimoku indicator lines have been surpassed, and the euro has not shown substantial growth over the past two weeks. In fact, the pair has been moving more sideways than upward or downward recently, so a flat movement is also likely. However, the price may be pressured by geopolitical developments and by U.S. inflation data to be released today.
On the 5-minute timeframe, exactly one trading signal of note was generated on Monday. During the European trading session, the price broke through the 1.1425-1.1433 area, but the buy signal proved false. All other signals should not have been considered, as the nearest target in each case was too close.
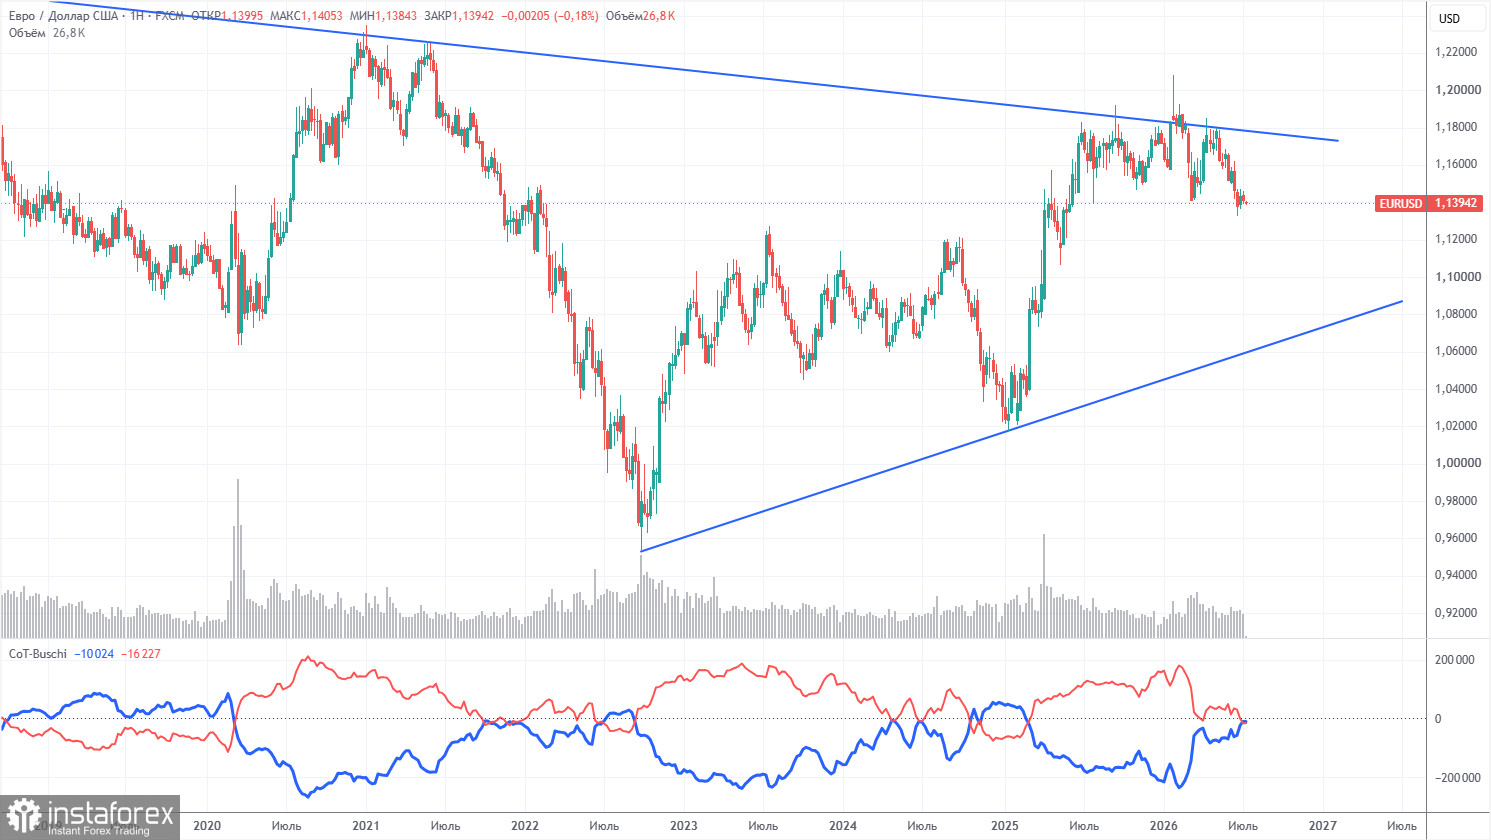
The latest COT report is dated July 7. The weekly timeframe illustration clearly shows that the net position of non-commercial traders remains "bullish" but has significantly decreased due to geopolitical events. Traders have been shedding the European currency in favor of the U.S. dollar in recent months. Donald Trump's policies have not changed, but the dollar has recently acted as a "reserve currency." However, this process may have already ended.
We still do not see any fundamental factors to strengthen the European currency, while there are enough factors for the U.S. dollar to decline. The war in the Middle East made the dollar temporarily super attractive, but when this factor reaches its "expiration date," everything will return to normal. And that may have already occurred. In the long term, the euro could fall to the level of $1.08 (the trend line), but the upward trend will still remain relevant. Moreover, in recent months of dollar strength, the pair has not come significantly closer to this line.
The position of the red and blue lines of the indicator indicates parity between bulls and bears. During the last reporting week, the number of longs in the "Non-commercial" group decreased by 12,200, while the number of shorts increased by 5,100. Consequently, the net position fell by 17,300 contracts over the week.
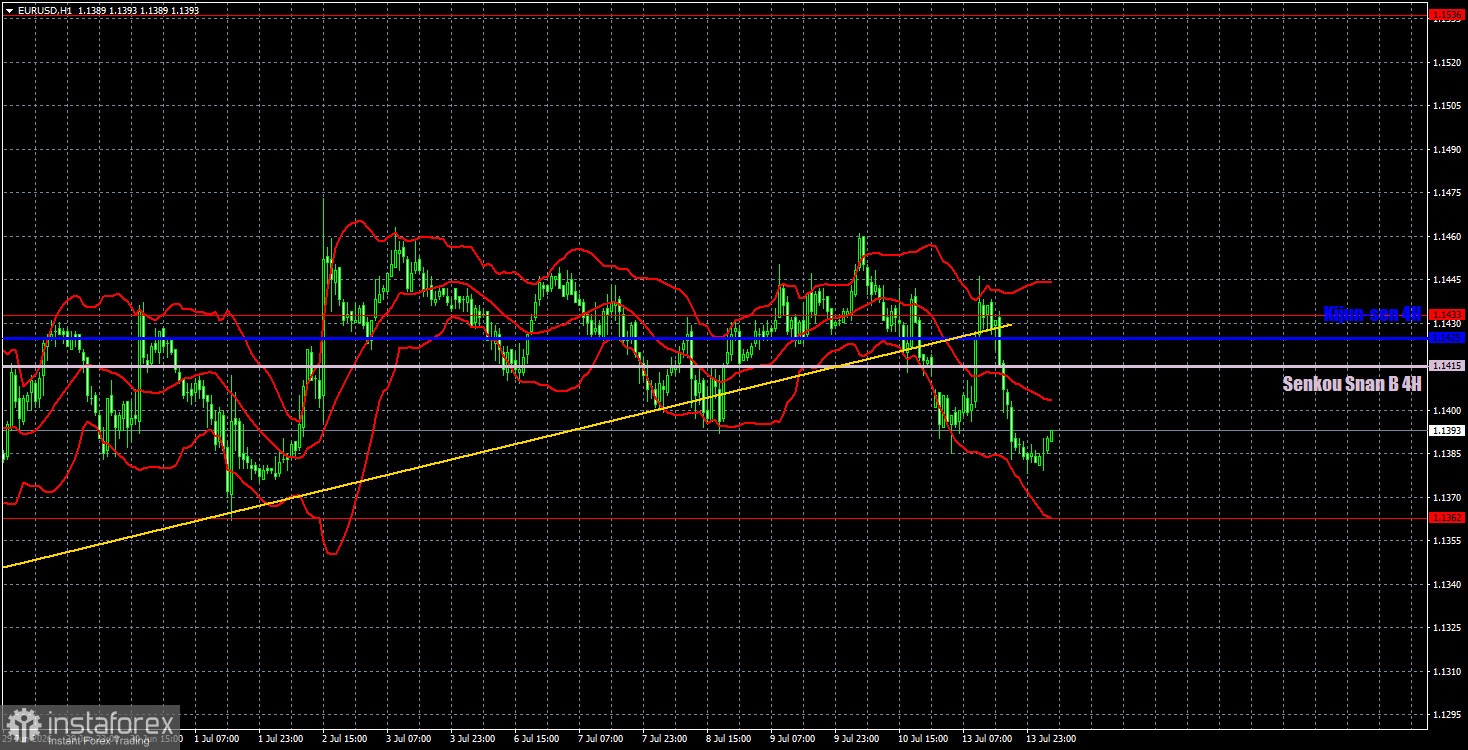
On the hourly timeframe, a corrective upward trend continues to form within a two-month downward trend. However, the pair is currently much closer to a flat or a resumption of the downward trend rather than further growth. The situation in the Middle East remains tense and is not improving. The market continues to ignore many factors in favor of the euro, so a decline in the pair may resume as early as this week.
For July 14, we highlight the following trading levels: 1.1234, 1.1274, 1.1362, 1.1433, 1.1536-1.1542, 1.1585, 1.1657-1.1666, 1.1750-1.1760, 1.1786, 1.1830-1.1837, as well as the Senkou Span B line (1.1415) and Kijun-sen (1.1425). The lines of the Ichimoku indicator may shift during the day, which should be taken into account when determining trading signals. Don't forget to set stop-loss orders to breakeven if the price moves in the right direction by 15 pips. This will protect against potential losses if the signal proves to be false.
On Tuesday, an important inflation report will be released in the U.S., but given recent developments in the Middle East and the oil market, it loses its significance. Inflation may slow, but if the Strait of Hormuz is closed again, oil prices will quickly rise above $100, and inflation will hardly continue to slow. Thus, the Federal Reserve may increase rates. Kevin Warsh is set to speak in the afternoon.
Today, traders may consider short positions targeting 1.1362 and 1.1274 if the price bounces from the Kijun-sen or Senkou Span B lines. Long positions can be opened with targets of 1.1415-1.1433 in the event of a price bounce from the level of 1.1362, which may serve as the lower boundary of the sideways channel. Volatility remains weak.
InstaForex analytical reviews will make you fully aware of market trends! Being an InstaForex client, you are provided with a large number of free services for efficient trading.


